

Urban Heat Island impact in Corpus Christi is heating up historically neglected communities and compounding harms from income stress, energy burden, and high asthma rates.
Greg Harman & Scott Kanski
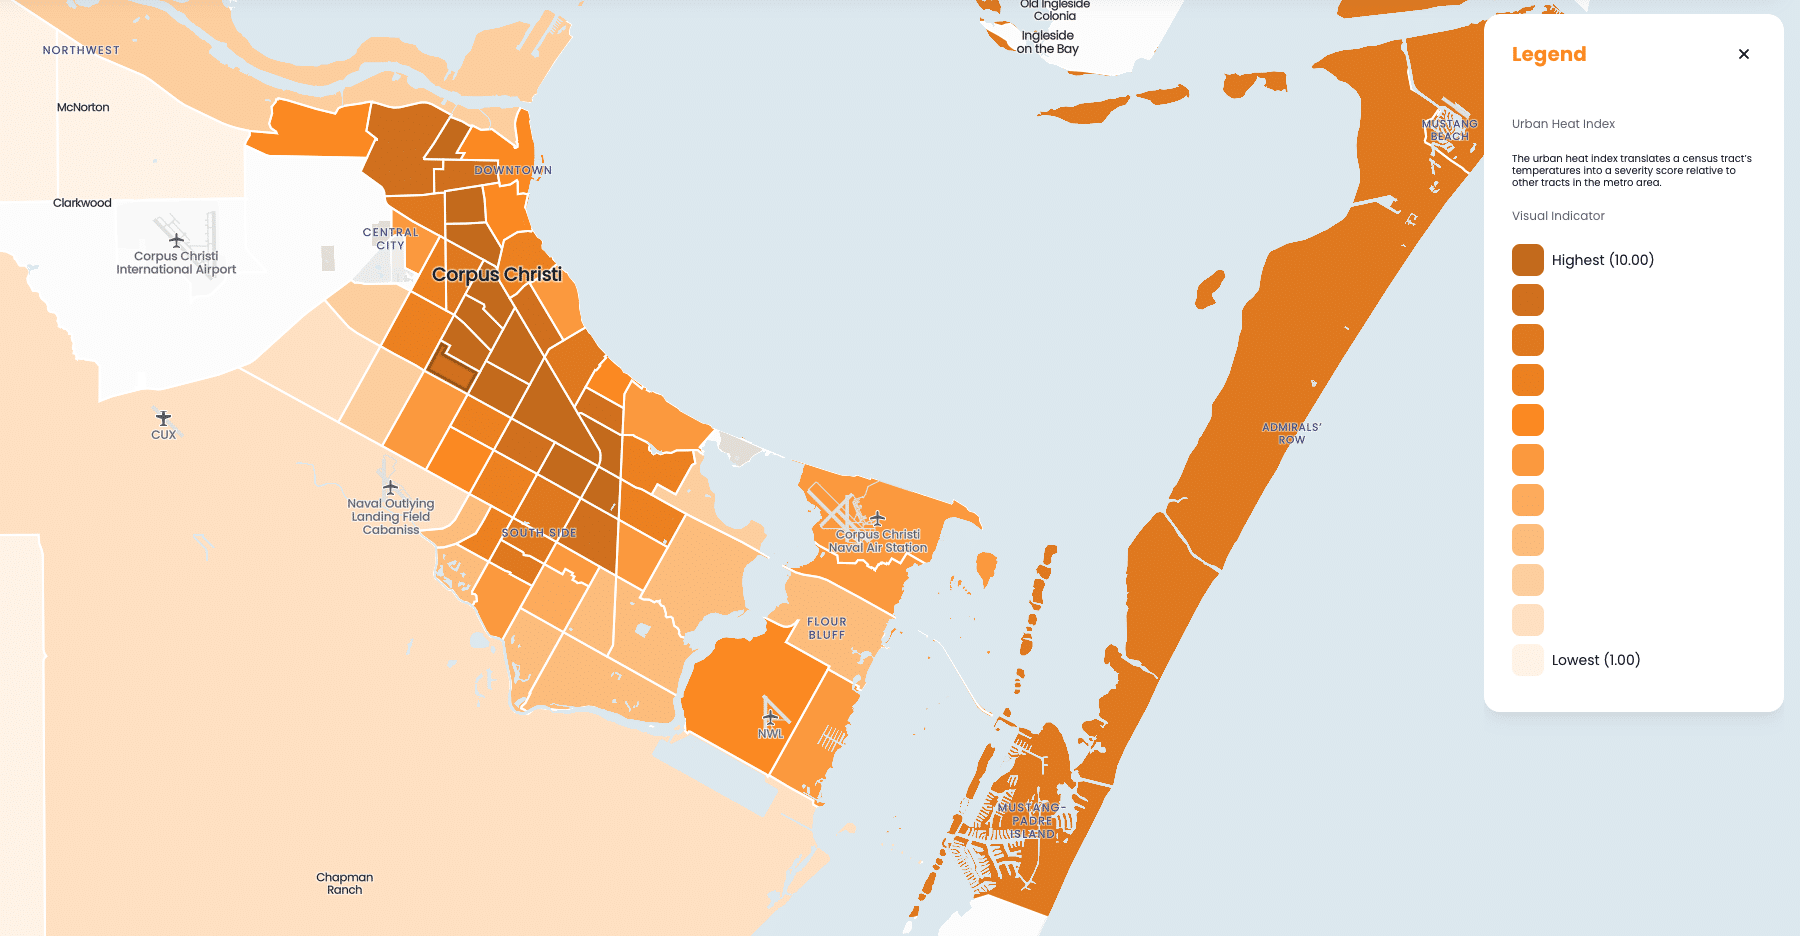
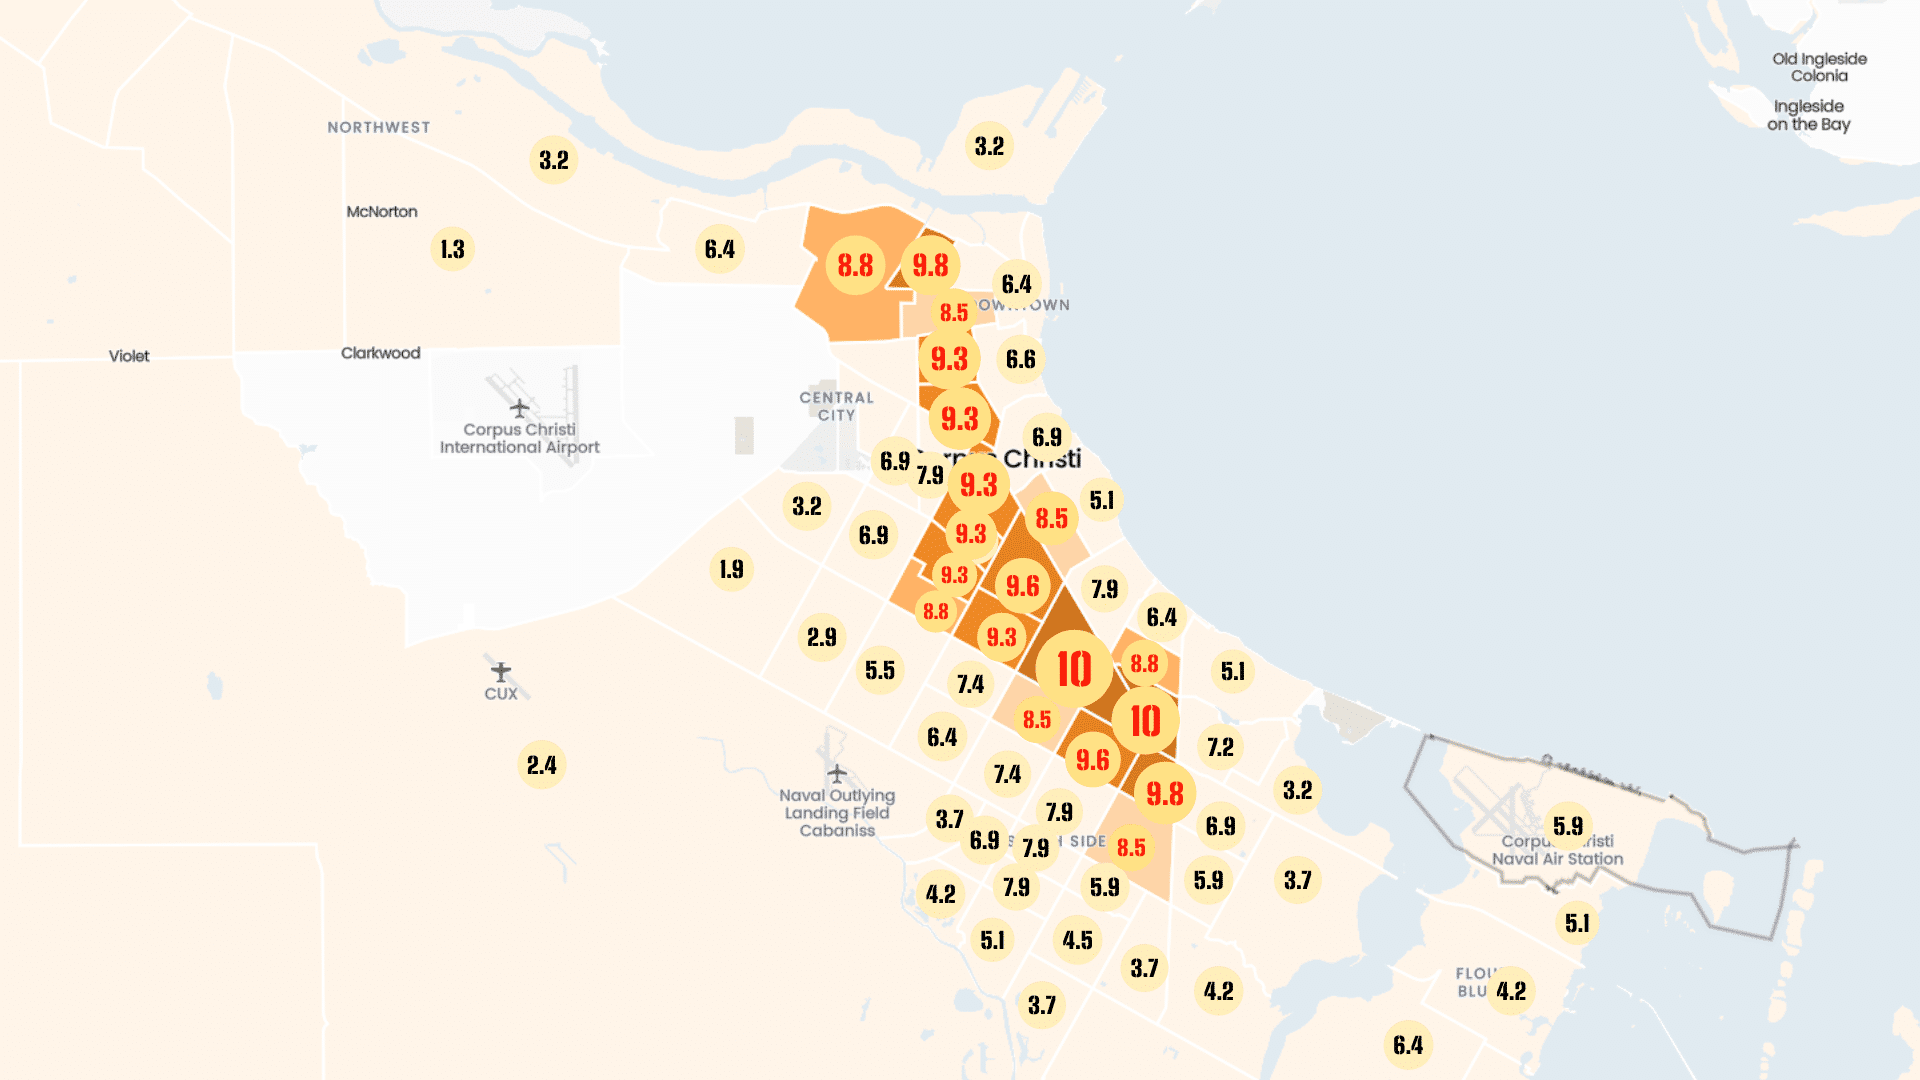
Corpus Christi’s urban core absorbs and retains far more heat than waterfront properties and those further inland due to the influence of urban heat island effect, a Deceleration analysis has found. This is especially true among disadvantaged communities around the heavily concretized South Central area and just beneath Refinery Row west of downtown. Some South Central and South Bay neighborhoods, including around the equally heavily concretized shopping malls of Palmera and Sunrise, score a perfect 10 as the city’s hottest tracts. Following these tracts are the communities of Hillcrest and the South Staples/South Corpus area.
Among Deceleration’s key findings are:
- Nueces County’s average Urban Heat Intensity (UHI) score is 5.9 out of 10, but the hottest tracts all exist in the core of the City of Corpus Christi.
- Seventeen of the hottest 20 Census tracts—which average a 9.15 UHI score—are disadvantaged communities by federal definition.
- The two hottest tracts (10 UHI score) huddle around the heavily concretized shopping malls of the South Central area.
- Hillcrest, a community abutting Refinery Row already burdened by the impact of industrial pollution and high rates of asthma, tied with a second-highest UHI score of 9.8.
- Only 7 of the 20 least-hot tracts mapped—which collectively scored a 2.32 UHI—are considered disadvantaged communities.
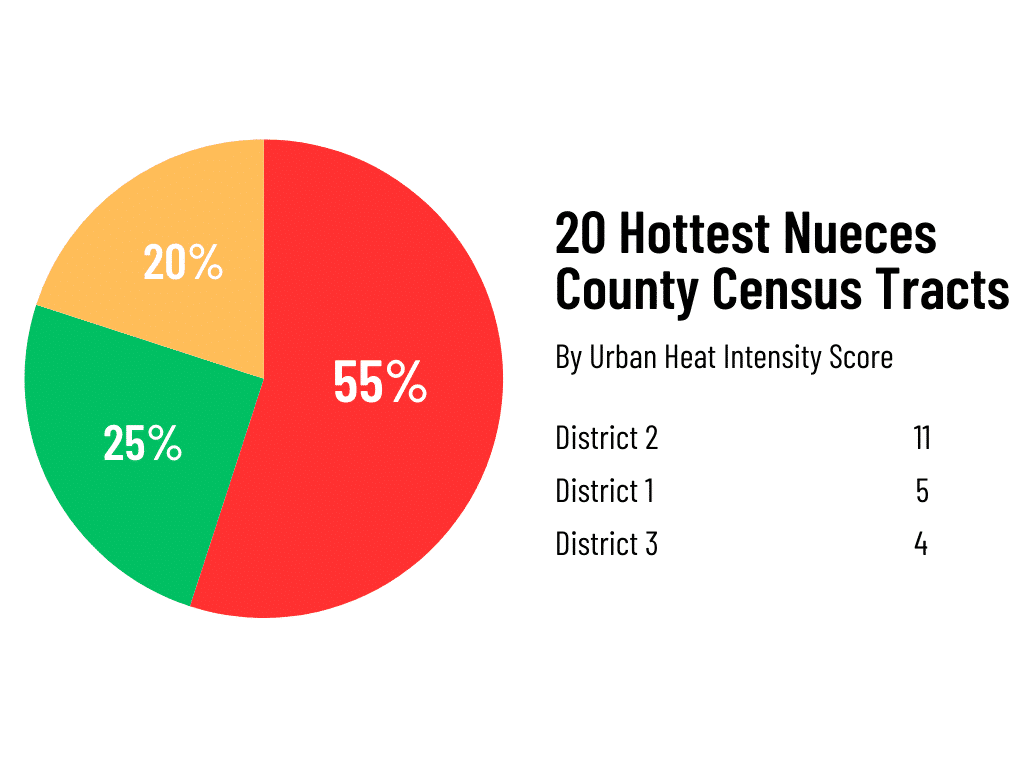
Deceleration used data from Greenlink Analytics and other public health mapping tools to consider a range of hazards compounding the risks generated by urban heat island. Broken down by Council Districts, Deceleration found 55 percent of the hottest Census tracts lie in District 2, currently represented by Sylvia Campos, who came into office amid a slate of environmentally minded candidates. Twenty-five percent (or five tracts) are in D1; and another 20 percent (or four tracts) are in D3.
Heat Driven by Climate Change
Rising extreme temperatures linked to the burning of fossil fuels are increasingly emerging as an existential health risk targeting Corpus Christi residents. Across the United States, heat, more than hurricanes, fires or floods, remains the leading cause of weather-related mortality. This extra heat—including accelerating heat index scores tied to increasing humidity—is not hitting everyone equally. Temperatures within cities are typically many degrees hotter than surrounding rural areas. Even within cities, historic development patterns, including replacing formerly green spaces with parking lots, road and rooftops, have focused the risk on some residents more than others by creating environments that capture and hold the heat for longer.
Residents of Corpus Christi, on the lower Gulf Coast of Texas, exist at a point of intersecting risks: industrially driven global warming is strengthening storms while raising sea-levels and putting thousands at risk of being permanently flooded out by 2040. Increasing petrochemical buildout also brings risks of toxic chemical emissions and fires. Additionally, increasing freshwater use by heavy industry puts the area’s access to affordable clean water and a healthy Gulf in further jeopardy.
Greenlink’s data is derived from nighttime satellite imagery collected during the hottest months of the year (May through August) and is intended to help understand the diversity of temperatures found within nearly 380 of the largest US metro areas. The resolution of this mapping platform is one square kilometer. Greenlink does not map temperatures, but rather displays temperature differences within a city—which areas are coolest and which are hottest and the range between them.
Urban Heat Island Defined
The U.S. Environmental Protection Agency writes that Urban Heat Island can result in urban centers that are 1–7°F higher than outlying areas and nighttime temperatures that are around 2-5°F higher. However, recent research examining decades of heat island temperatures shows that pockets of cities like San Antonio (for example) can be up to 14°F hotter than the average area temperature and up to 21°F higher than surrounding rural areas.
“Heat islands are urbanized areas that experience higher temperatures than outlying areas. Structures such as buildings, roads, and other infrastructure absorb and re-emit the sun’s heat more than natural landscapes such as forests and water bodies. Urban areas, where these structures are highly concentrated and greenery is limited, become ‘islands’ of higher temperatures relative to outlying areas.”
This mapping project joins “Greater Corpus Christi’s Most ‘Utility Burdened’ Neighborhoods” among Deceleration’s community resources serving Corpus residents. Deceleration consulted a range of analyses quantifying public health risks at the “Sparkling City by the Sea” to understand how heat may be interacting with other stressors to inequitably punish some residents more than others. This resource will be updated in the future as new data becomes available.
Hot Zone: South Central & South Bay
Census Tracts 24 & 26.02
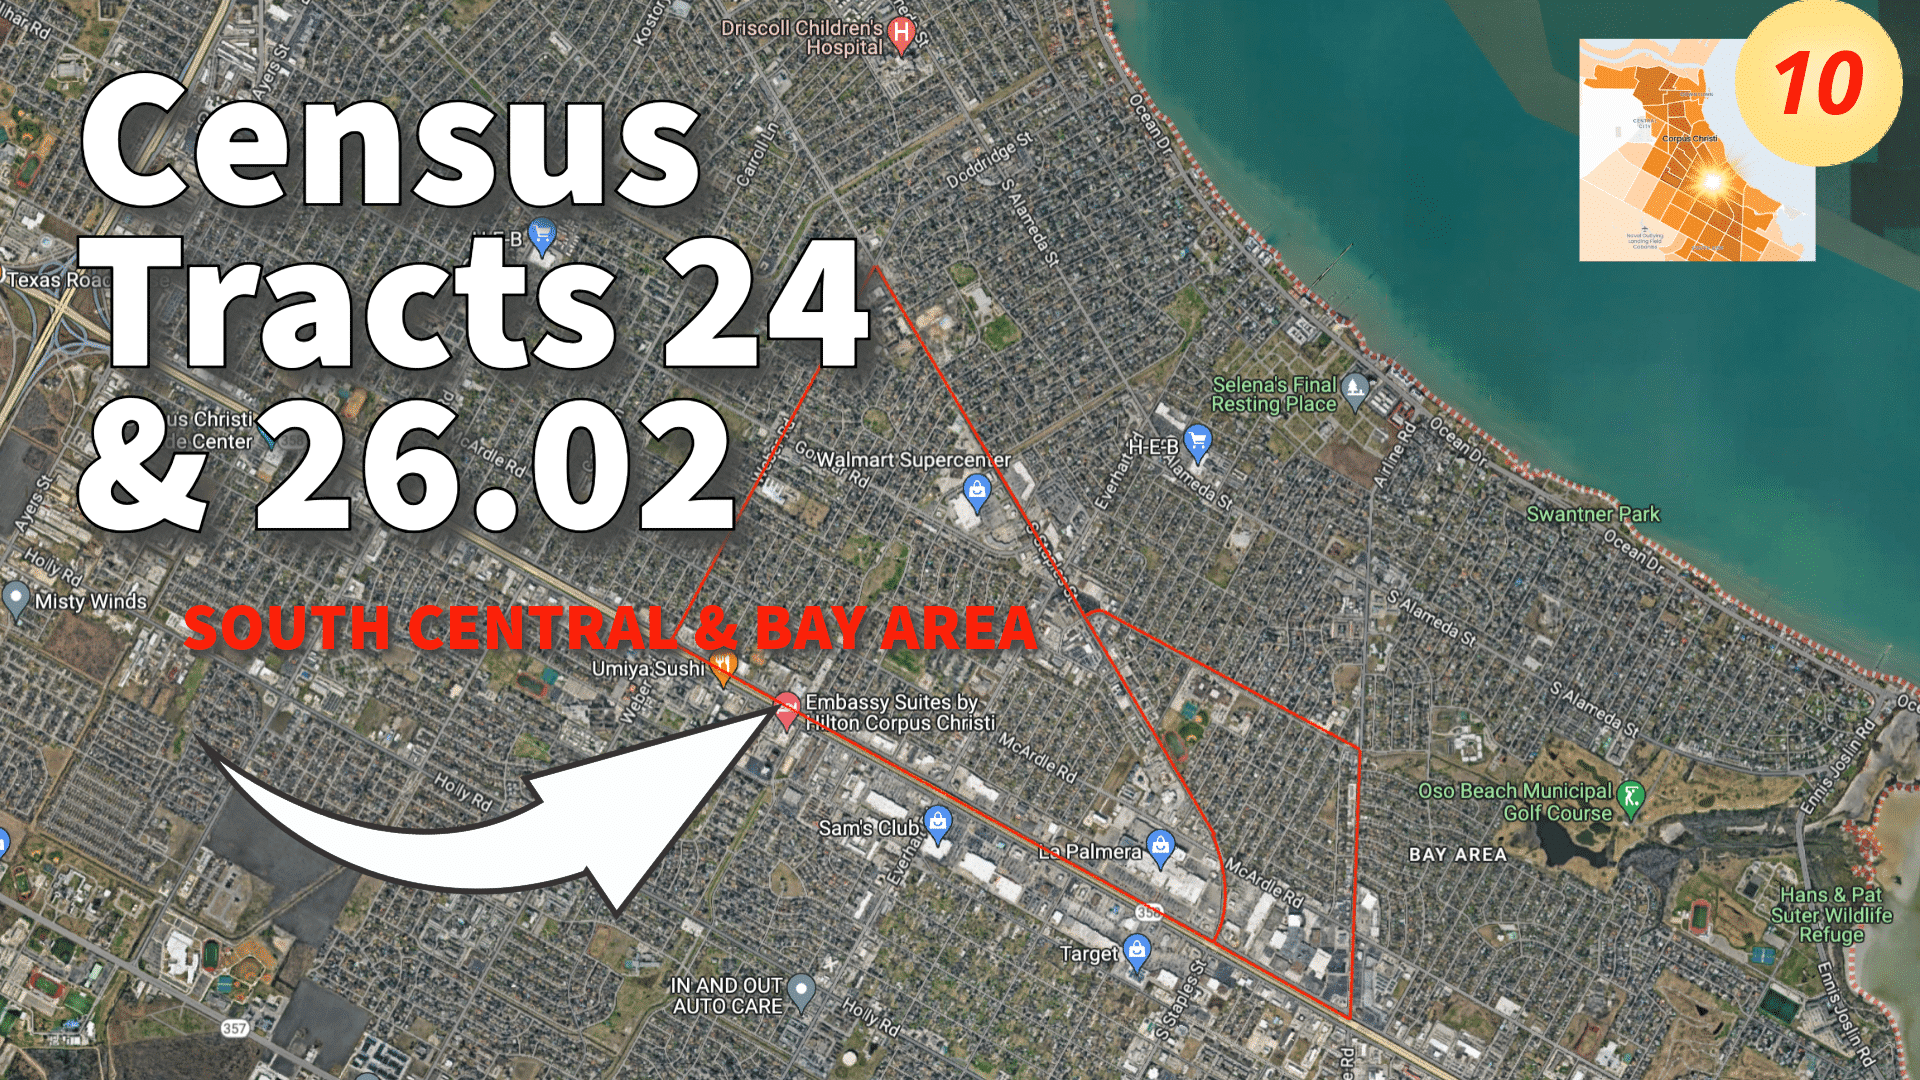
Heavy paving around the shopping malls like La Palmera in the South Central area of Corpus Christi undoubtedly contributed to this area ranking as the hottest zone in Nueces County. The area is bordered by Highway 358 and South Staples, asphalt and traffic that certainly add to the overall heat. Additionally, Census Tracts 24 and 26.02 are marked by moderate energy burden and income stress, with median incomes around $38,000 and $34,000, respectively. Census Tract 24 is additionally considered a disadvantaged community as it is “within the top 10% of economic, environmental/climate, health, or housing burdens,” per Greenlink definition.
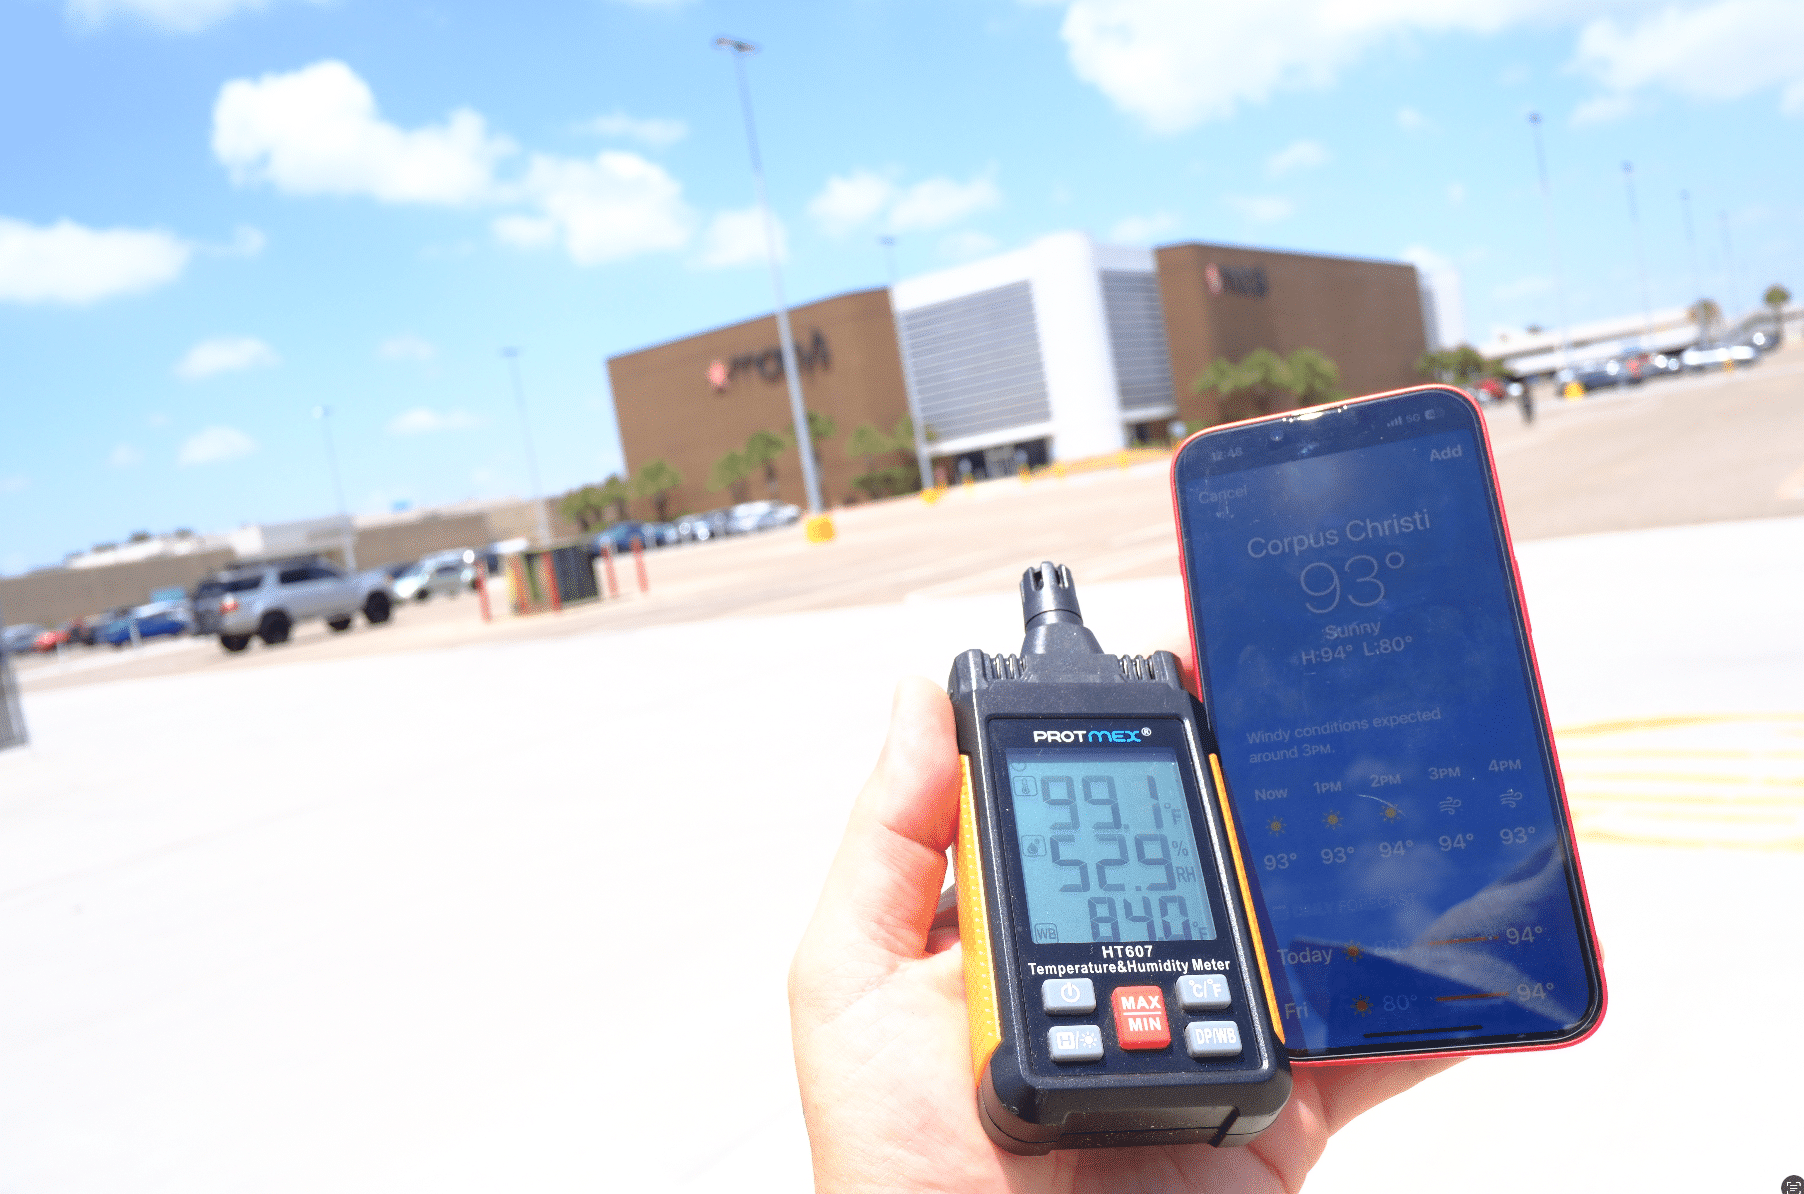
Deceleration measured the heat outside the La Palmera shopping center with a hand-held temperature and humidity gauge in early July 2024. We found the temperature fluctuating between 6 and 8 degrees above the official Corpus Christi temperature of 93° F, as measured 11 miles away at Corpus Christi International Airport.
Hillcrest
Census Tract 5
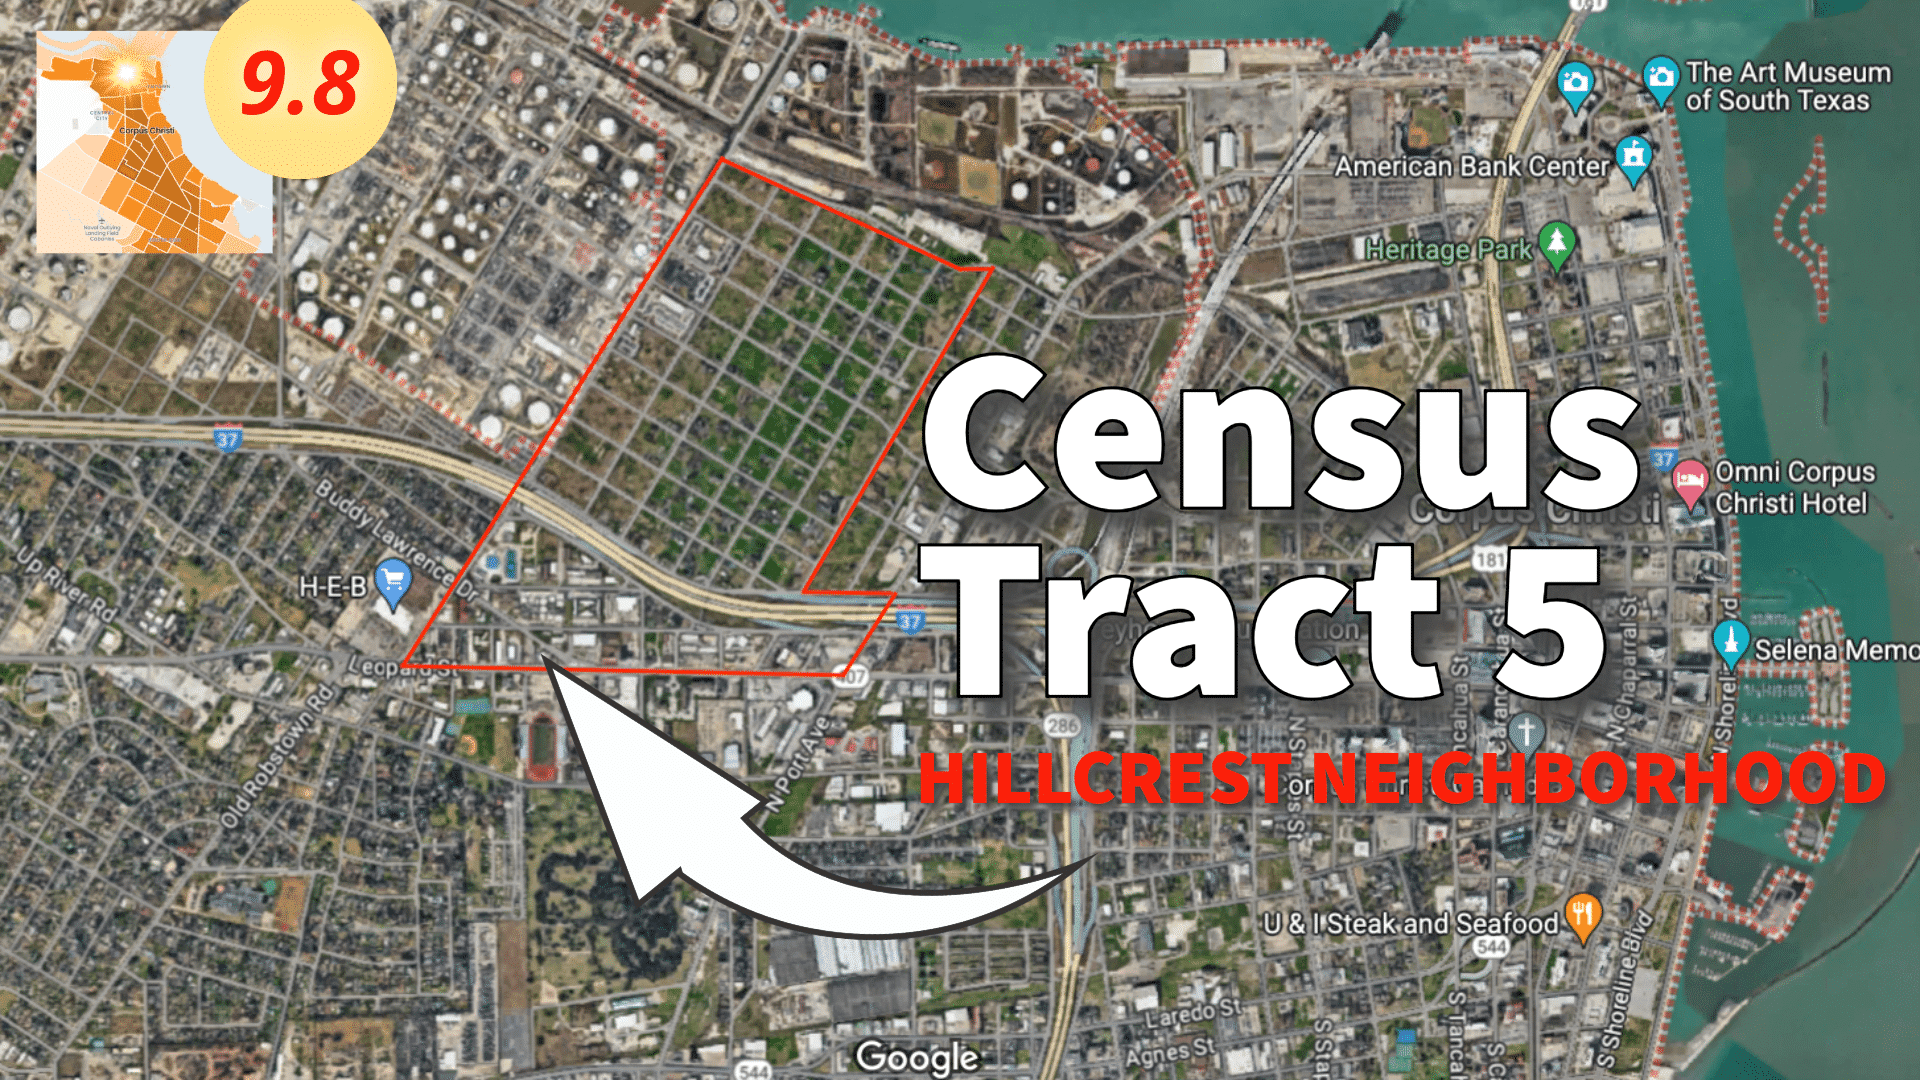
Census Tract 5, just south of “Refinery Row”, is one of the hottest Census tracts in Corpus Christi. But residents here also suffer from the highest asthma rates in Nueces County. Hillcrest is nearly 97 percent people of color; the Climate and Economic Justice Screening Tool (CEJST) also identifies the neighborhood as a disadvantaged community. Nearly 70 percent of the residents here rent their homes, paired with one of the highest rates of eviction in the county, meaning all that extra heat leans into a range of preexisting vulnerabilities. Proximity to heavy industry likewise does not pair well with one of the lowest tree equity scores in the city.
Southside/South Staples
Census Tract 33.05
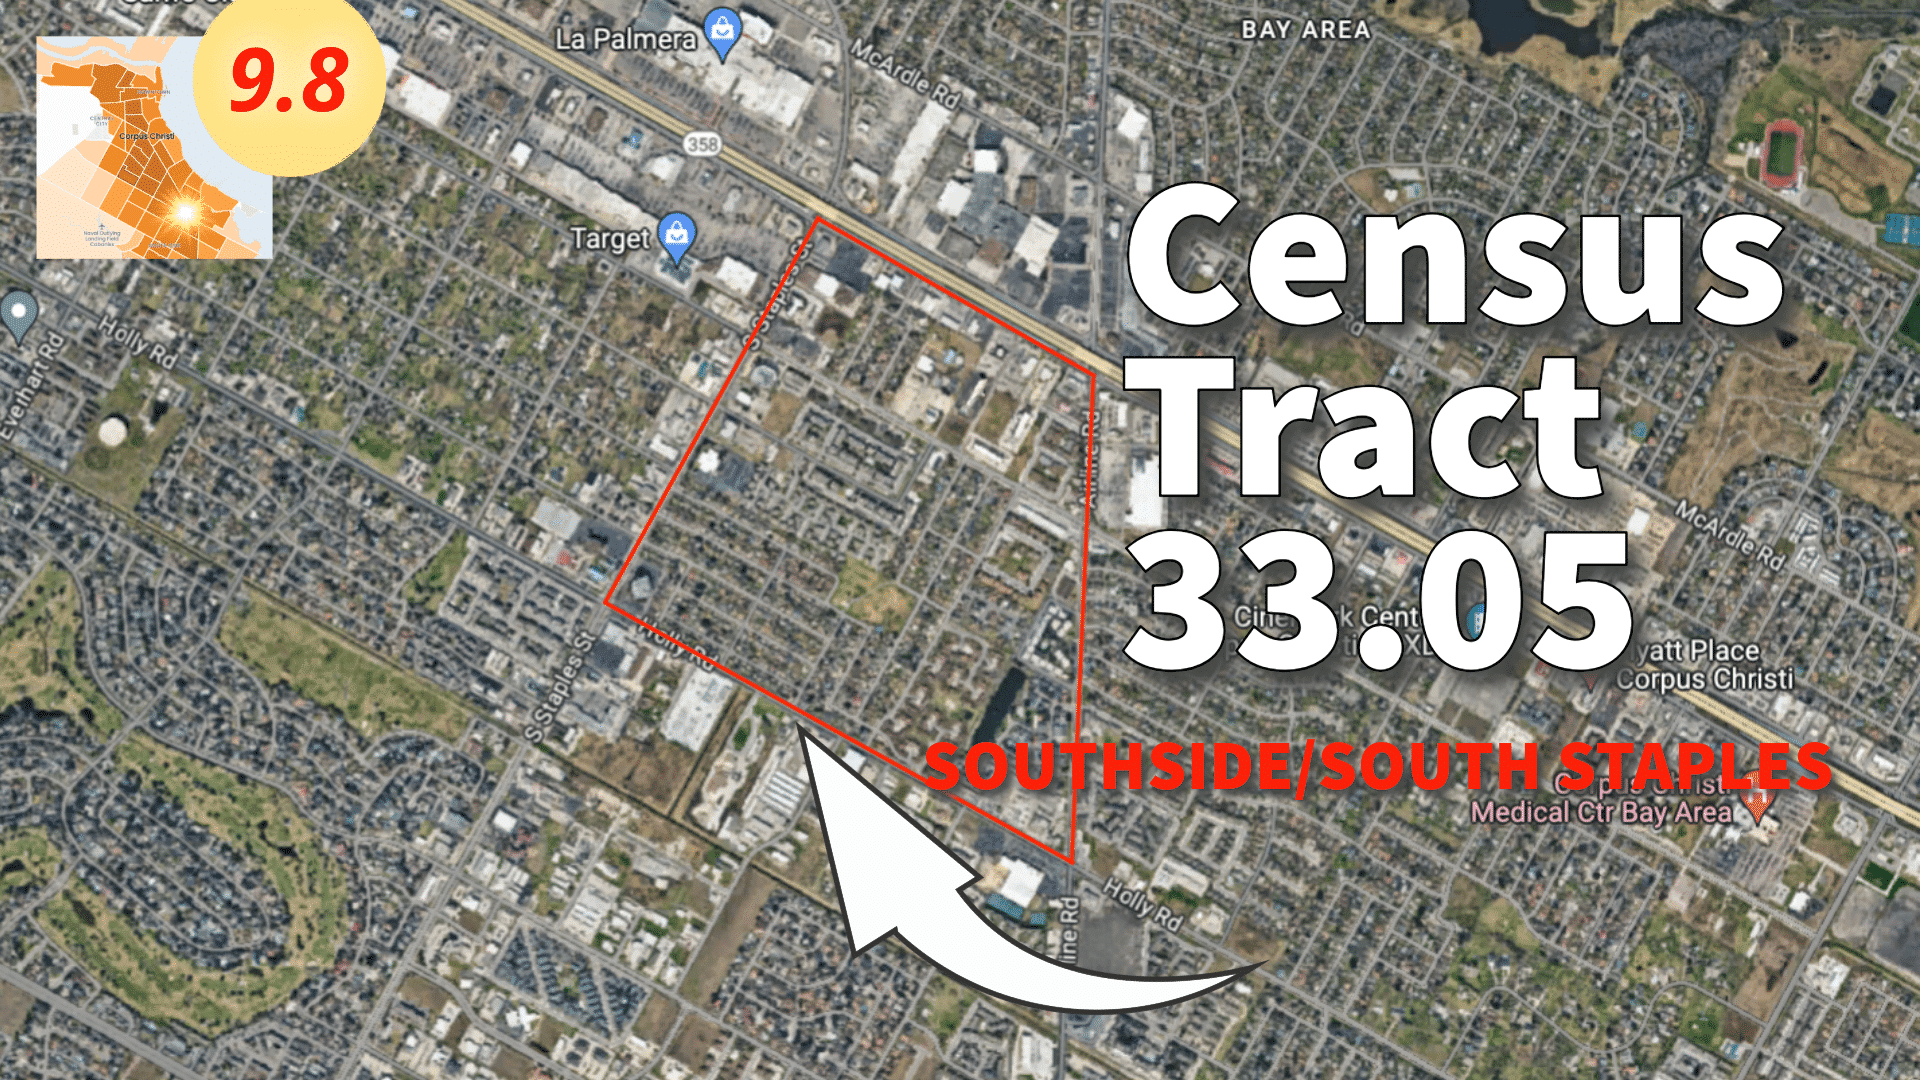
Census Tract 33.05, on the city’s south side, also experiences some of the highest asthma rates and heat island impact in all of Corpus Christi. This predominantly Latinx community (73 percent) is comprised of over 70 percent of renters, making initiatives intended to reduce heat harms in homes (like the Texas Weatherization Assistance Program) inaccessible to most residents.
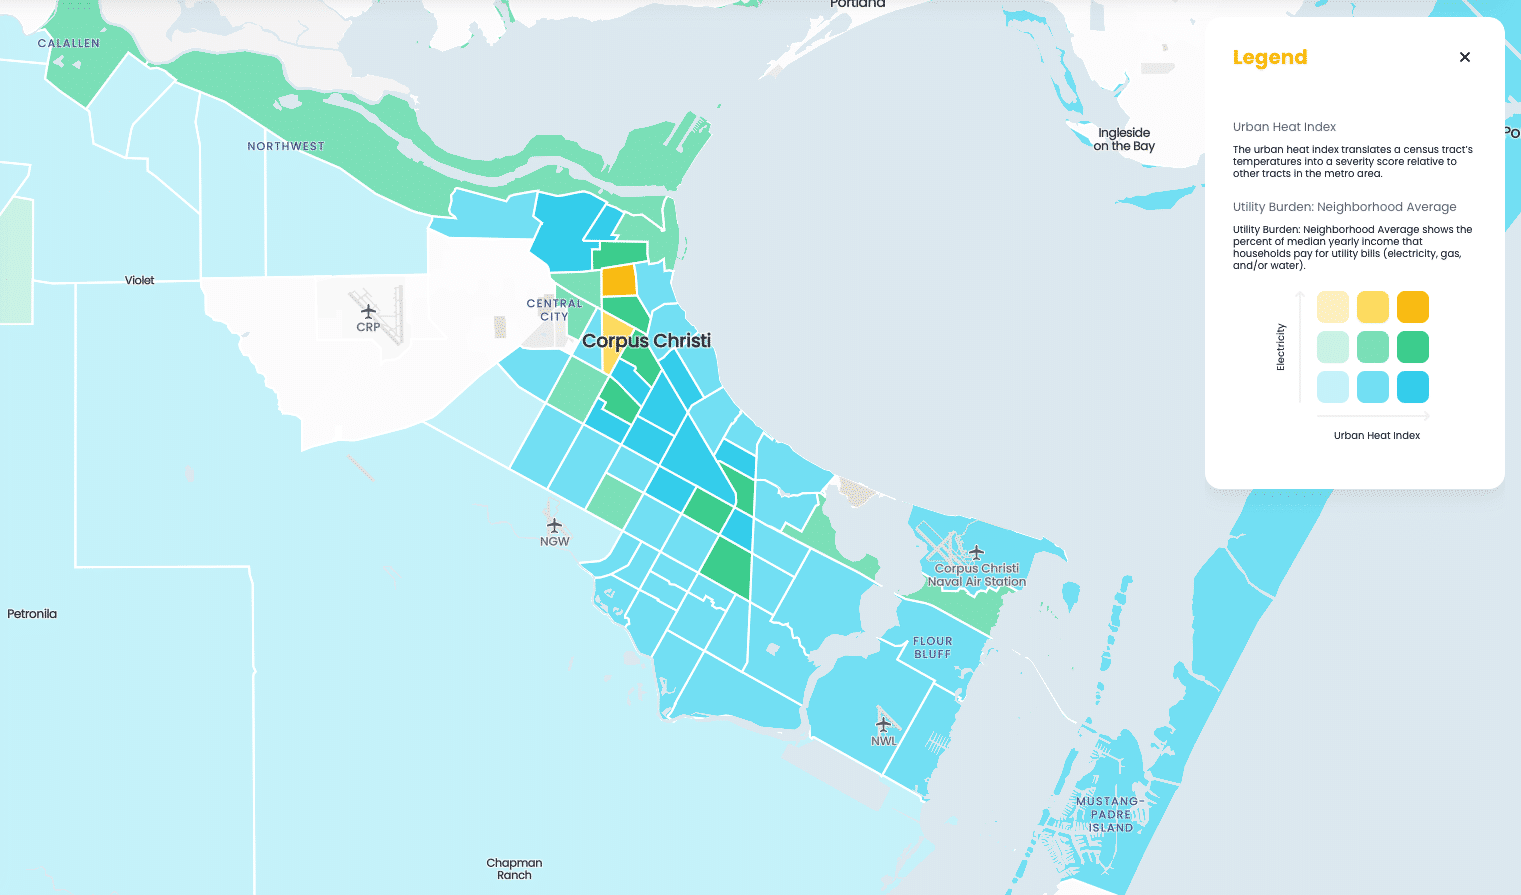
Urban Heat Island & Energy Burden
Energy Burden is the percent of yearly income that households pay for electricity, gas, and water bills. Households nationally on average pay about 3% of their income on energy bills. A household that pays more than 6% of their income on energy bills is considered to have high energy burden, while a household that pays more than 10% is considered to have severe energy burden. These indicators show the number of households with energy burdens above the 3% national average, the 6% threshold for high energy burden, or the 10% threshold for severe energy burden across different census tracts.(Greenlink Analytics)
Here’s what happens when we add Energy Burden to the Urban Heat Island map. High heat island is designated by darker colors; high energy burden is designated by yellow (high) green (moderate) and blue (low). Residents of those yellow tracts are paying roughly 20 percent of their annual income on utilities.
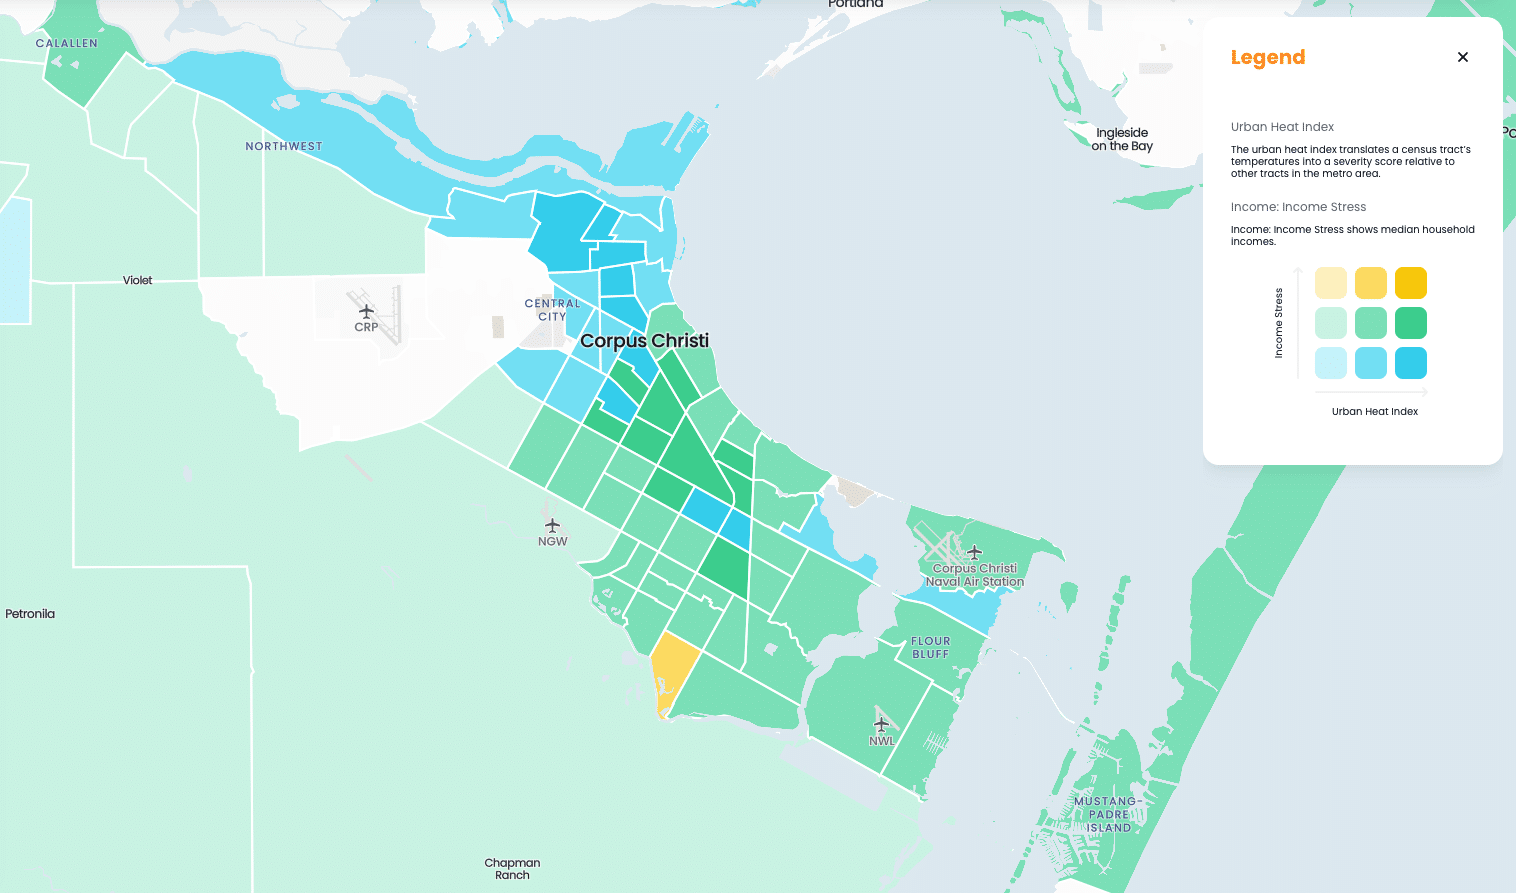
Heat Island + Income Stress
Income: Income Stress shows median household incomes. (Greenlink Analytics)
Here’s what happens when we look at overall income stress. High income stress is designated as high (yellow), moderate (green), and low (blue).
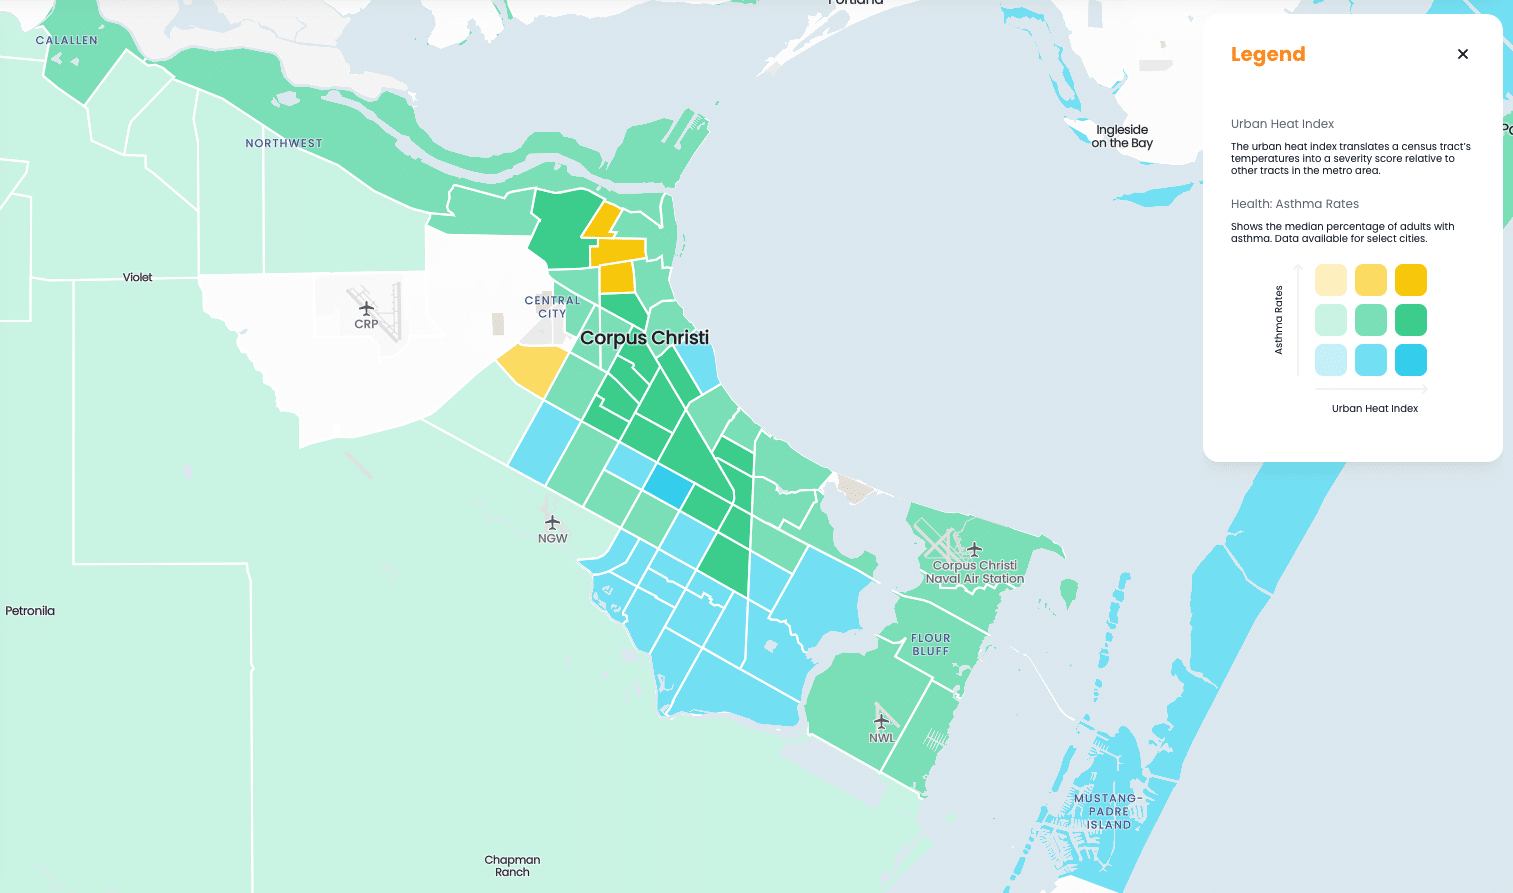
Heat Island and Asthma
Shows the median percentage of adults with asthma. (Greenlink Analytics)
Heat Island and Race
Influence of Urban Heat Island broken down by race, showing Latinx residents across the Center City, white residents in Port Aransas, and African-American residents near Refinery Row are highly impacted by UHI. (Greenlink Analytics)
Greenlink Analytics methodology
Greenlink Analytics prepared an Urban Heat Island dataset for all (378) metropolitan statistical area (MSA) boundaries, in the United States, down to a census tract level, by converting census tract and metropolitan boundaries from the US Census Bureau to a geographic format. The Google Earth Engine (GEE) Python API was leveraged to access MODIS Night Land Surface Temperature (LST). Temperatures, originally in Kelvin, were converted to Fahrenheit with a focus on May-August temperatures for each year of study.
-30-
Like What You’re Seeing? Become a patron for as little as $1 per month. Explore ways to support our mission. Sign up for our newsletter (for nothing!). Subscribe to our podcast at iTunes. Share this story with others.


