

Welcome to Water and Power, a newsletter about the elements of our survival—and those who seek to profit off them. Water & Power delivers unique reporting to prepare you to engage on the issues dear to your heart, including notices of upcoming events and highlights from across the media landscape.
If you know someone who would appreciate this research and analysis, pass it along. Subscribe to this and our growing roster of Deceleration newsletters. Paying supports from the $5/month level up may leave a comment below. Reader support makes this work possible.
— Greg Harman
SAN ANTONIO, Texas—On Tuesday, the official high in San Antonio was 98 degree Fahrenheit. But, as folks who follow Deceleration know, that doesn’t mean squat for those in the urban core, where all this concrete and asphalt and unceasing highway traffic amplify the heat of summer. When the temps reported by the meteorologists click into the danger zone, we have to protect ourselves. Because we know that temperatures where we live can be 10 degrees hotter—or more—than the official numbers.
While 98F was logged in the shade at San Antonio International Airport, my street briefly hit 107.
At Deceleration we think a lot about the heat. For good reasons.
When our neighbor Albert Garcia died in 2023, we measured his old camp site at 114 during the day when the official temp was 105. And when our friend Jessica Witzel died during an extreme heat event in the summer of 2024, the temperature at the site of her death was 106F. But just one day before, I recorded downtown temps of 119—just a few miles away from where she died—and a heat index of a dizzying 129.
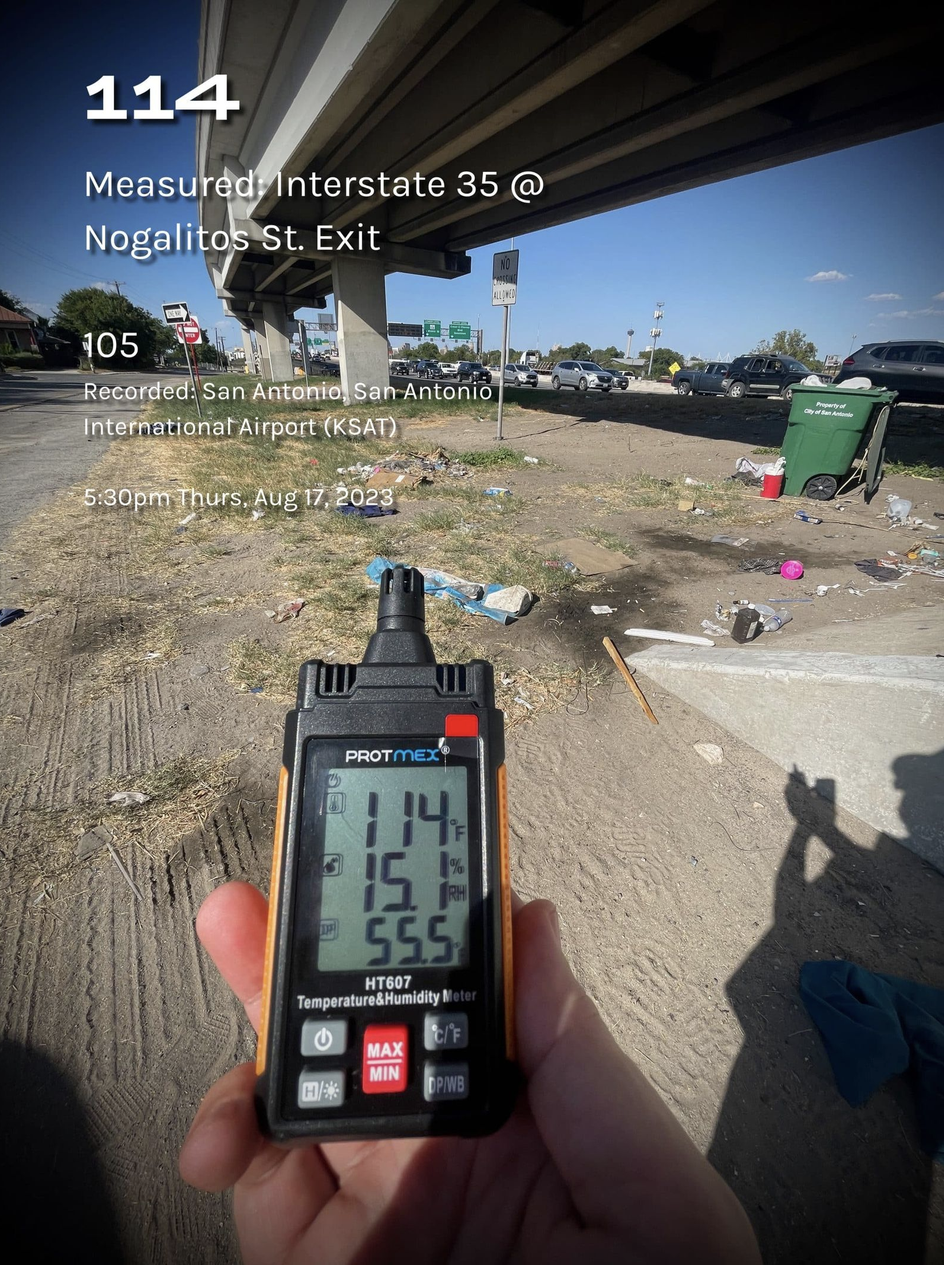
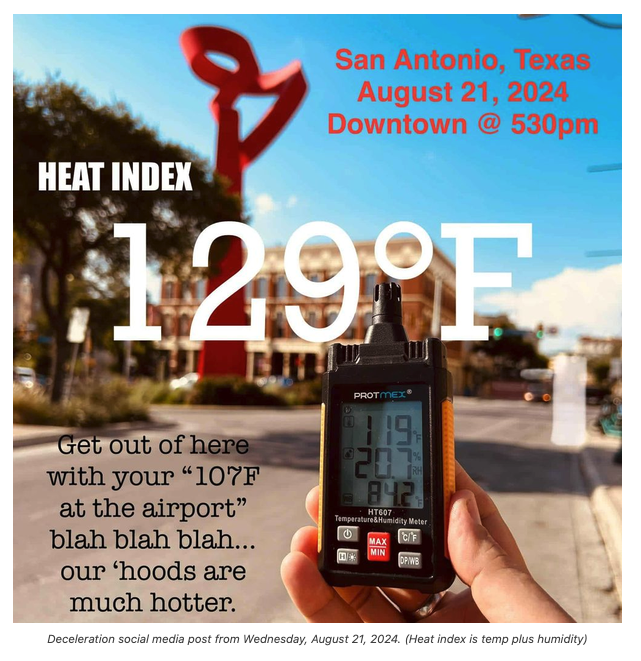
Heat at Albert Garcia's former campsite in 2023 (left) and temperature recorded the following year one day before Jessica Witzel's death in the Five Points area of San Antonio.
Extreme heat driven by the combustion of fossil fuels and destruction of global forests strains our power grid. It drives up our energy bills. And it claims lives.
While temps in Texas have been rising steadily in recent decades, cities like San Antonio are investing in policies in try to dampen the heat’s impacts. Tree planting campaigns, “cool” pavement programs, preservation of greenspace, encouraging rideshares.
But how would you respond if massive industrial facilities that excel in pushing out superheated air moved into the neighborhood? What if they were suddenly popping up across your community, threatening to undermine all of your best heat work?
It turns out hyperscale data centers aren’t merely gluttons for water and power; they are also frequently generators of massive heat islands, raising area temps on average around 4 degrees Fahrenheit.
And sometimes much more.
We wanted to see what that looked like in San Antonio, Texas.
Deceleration Video
The official temp was 98°F but in the shadow of a clutch of large data centers in San Antonio the temps cranked up to 112°F. This investigation explores the urban heat island effect and reveals how massive data centers are contributing to an escalating heat emergency. Follow Deceleration on YouTube.
Survey!
SA Climate Ready 2035 Survey: 'A Priority Plan for a Climate Ready San Antonio'
The extreme heat and storms associated with global warming are already unraveling human and ecological societies across broader swaths of the planet. U.S. cities are far from immune.
“What we're seeing in some parts of the city is: it's very unlivable, in a way, during certain months of the year,” said Jennifer Brady, senior data analyst and research manager at Climate Central. She heads the nonprofit’s data-driven investigations into climate trends and impacts.
“It's going to become really unmanageable to be outside at the very least,” Brady said. “Like, how can people live in cities and go outside their homes? And then you see places like Phoenix where they're thinking about, you know, 3 or 4 months a year, how does a city function in this heat?
"On top of this, we must now consider the heat being pushed out around the clock by data centers. Facilities that are actively, in Brady's words, “creating more spaces where that [ie. livability] might be a challenge and a question.”
The most significant paper we found on data center-generated heat was produced by an international team of researchers from a collection of universities and research institutions. The group reviewed decades of heat data for their study and considered data centers across the planet. To weed out other potential influences, they isolated large scale (or hyperscale, to use industry parlance) data center operations in rural areas.
Their finding?
Heat increases ranging from just half a degree Fahrenheit to 16.4F. The average across all hyperscale data centers studied was 3.73F. And it was heat that could still be measured up to seven (or more) kilometers away.
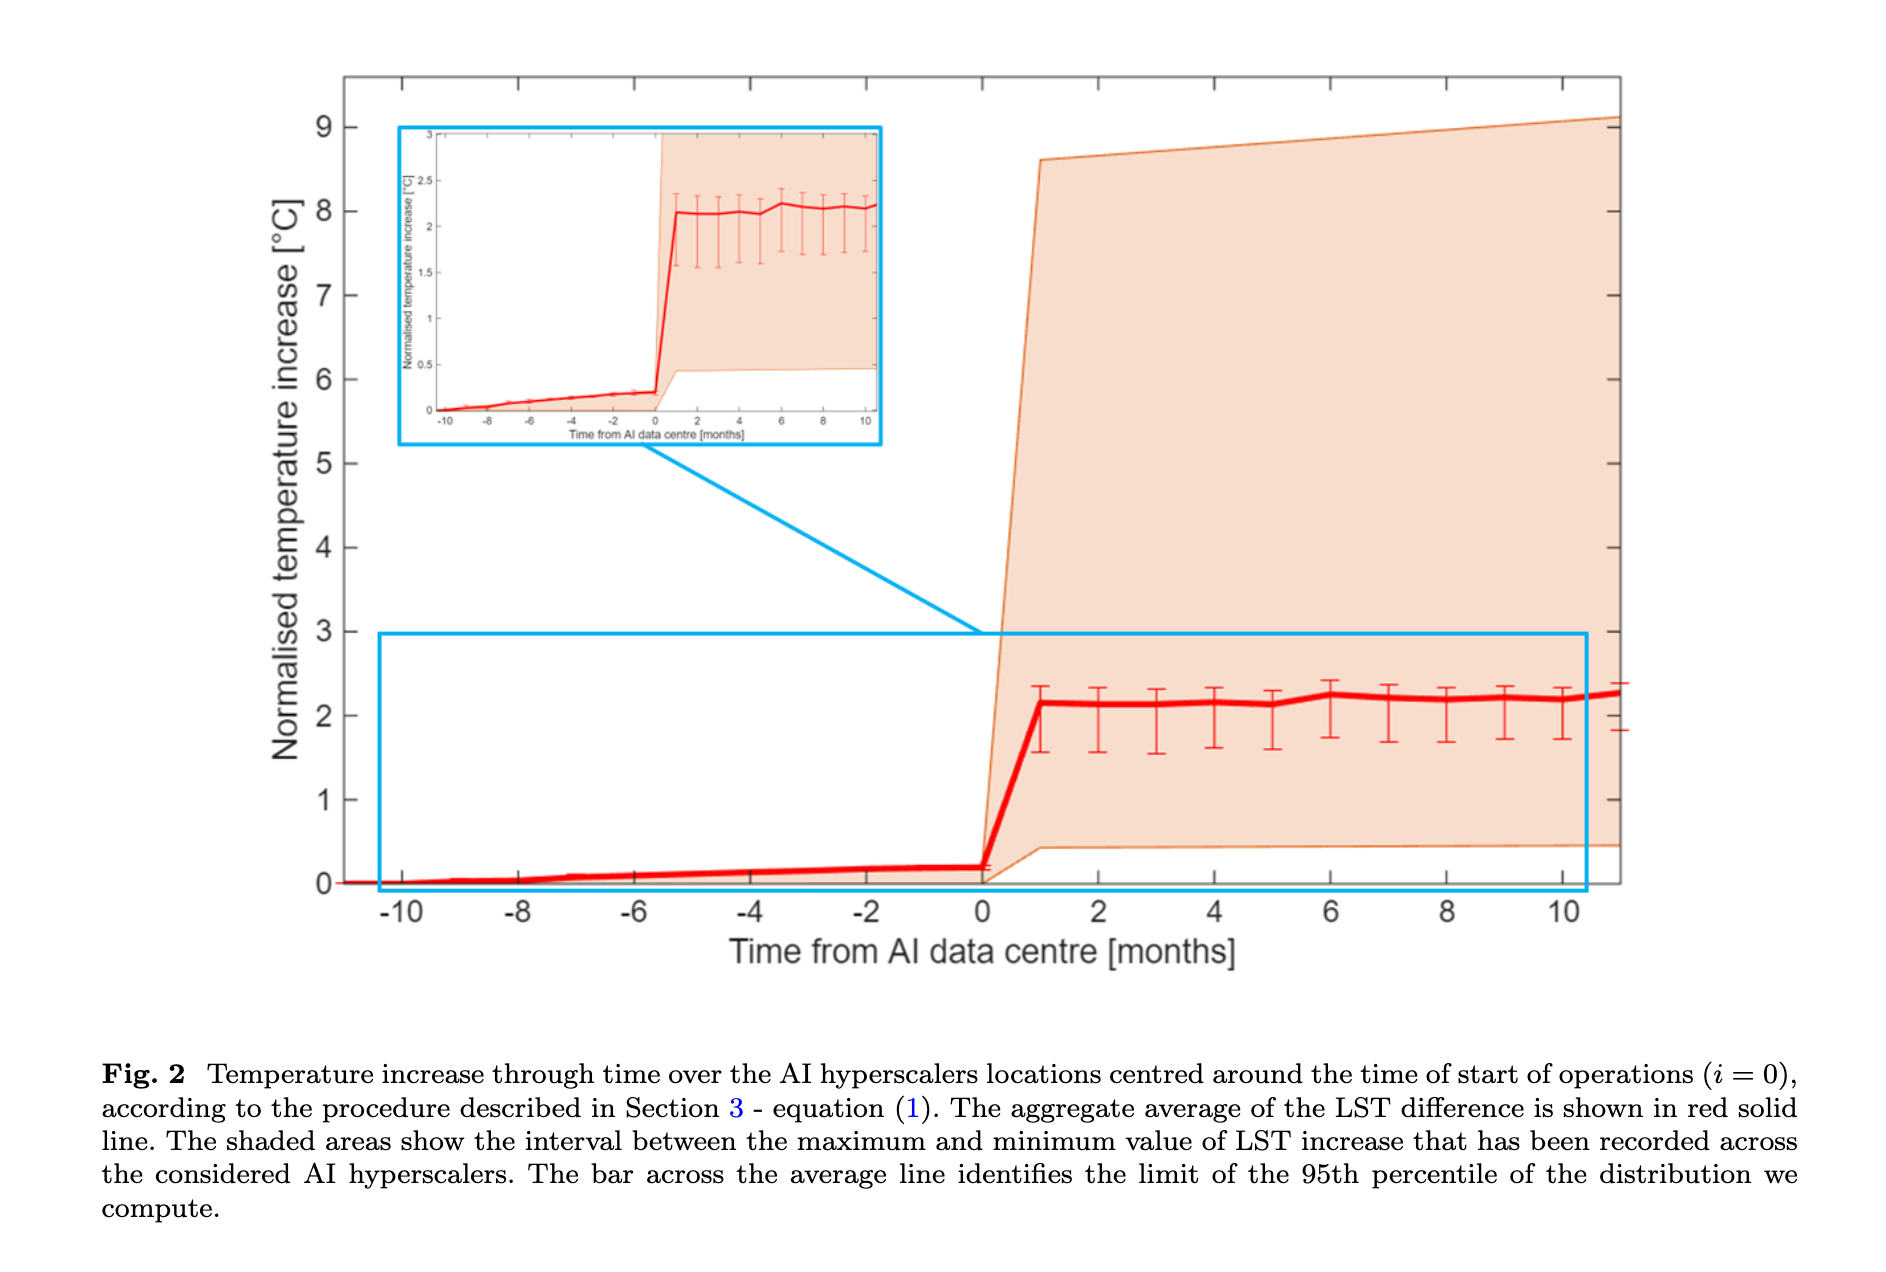
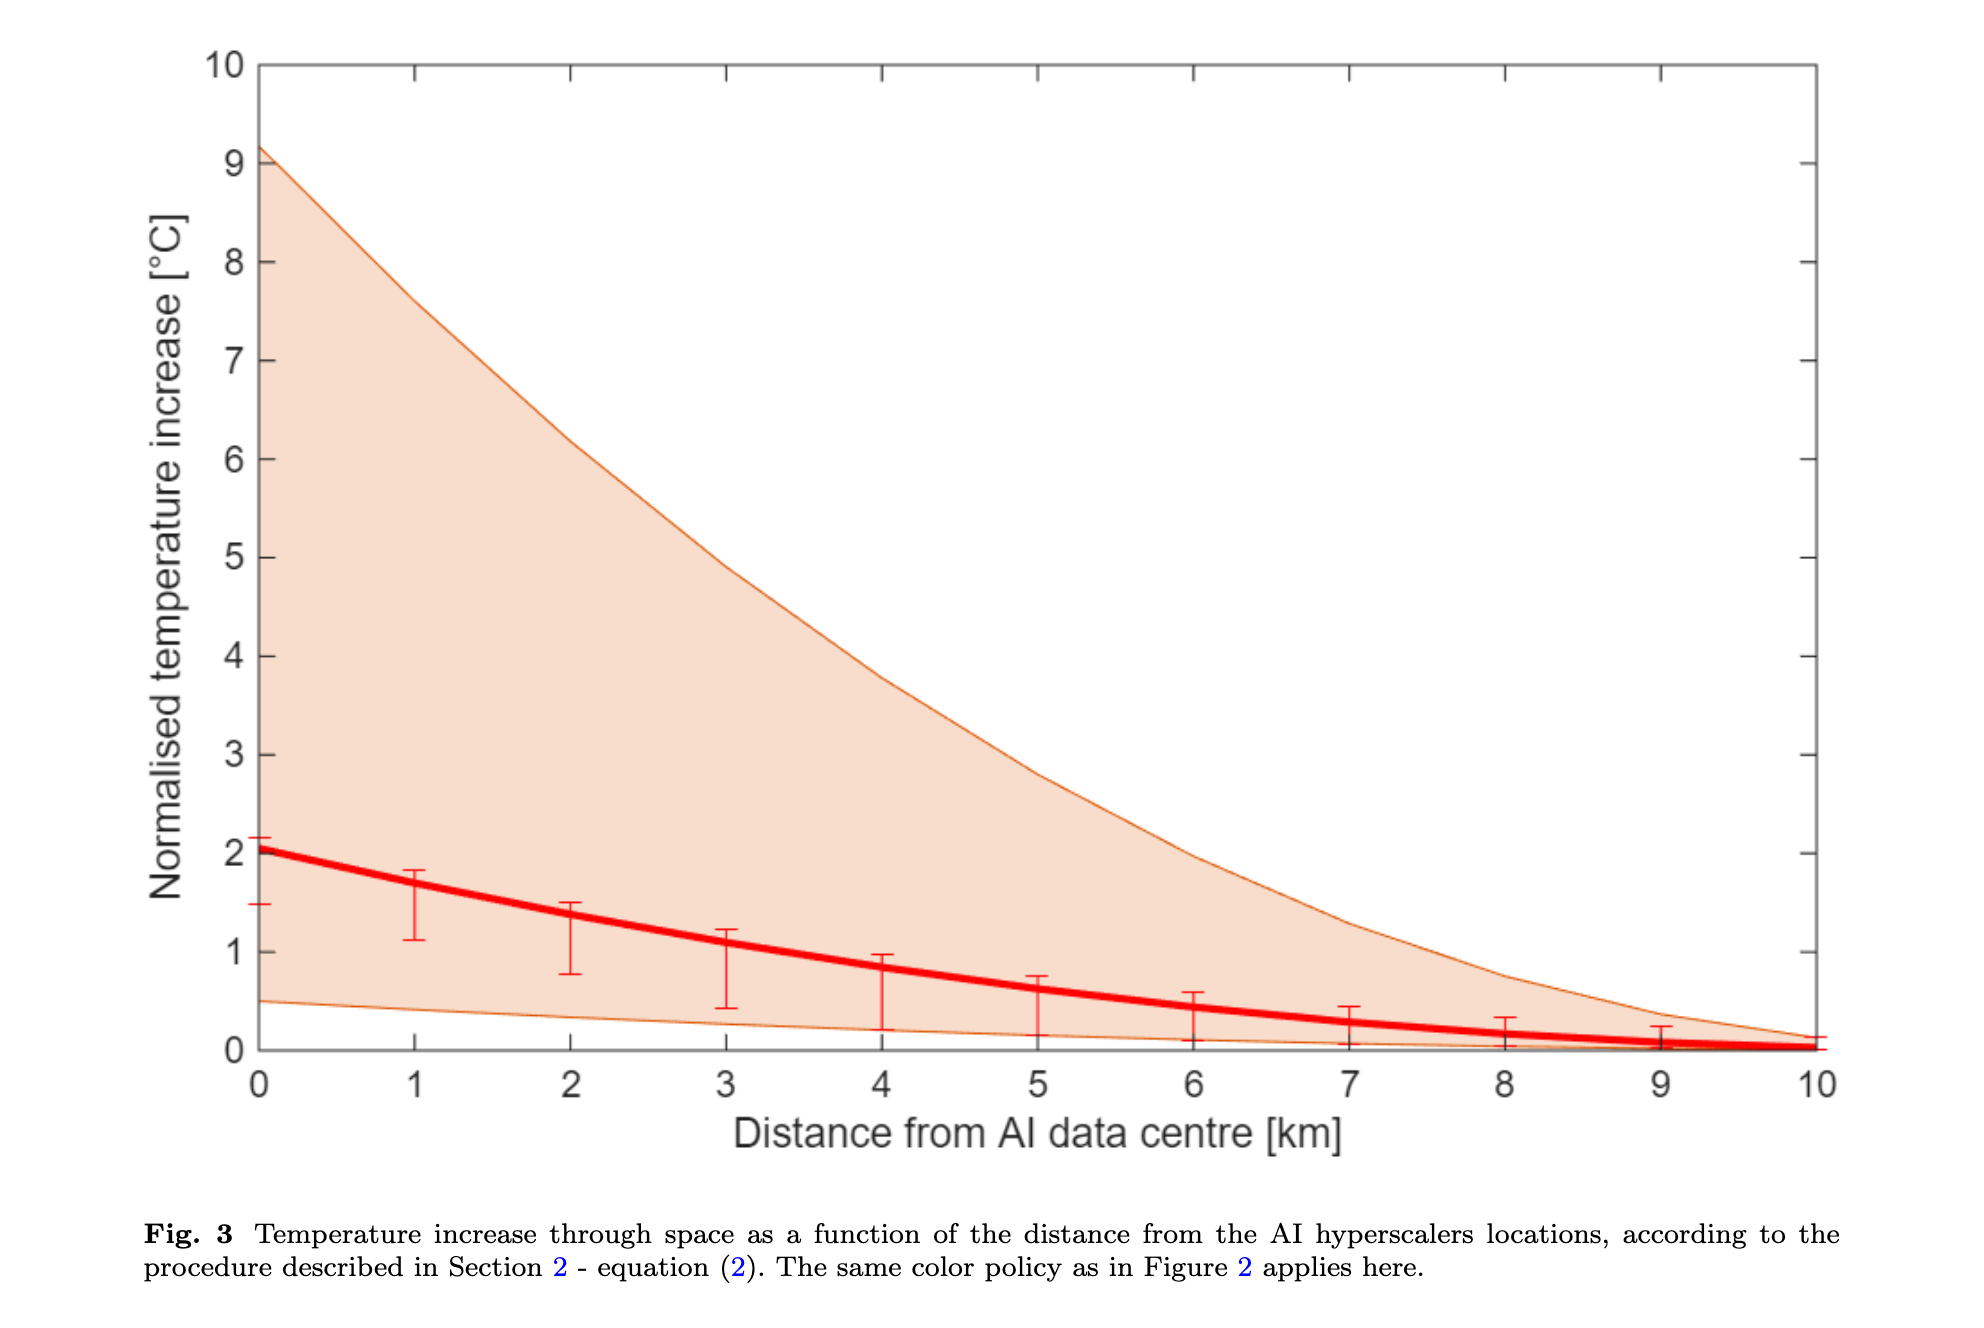
Amount of heat released (left) and geographical spread of that heat in kilometers (right), from recent study into hyperscale data centers operating in rural areas around the world. From: 'The data heat island effect: quantifying the impact of AI data centers in a warming world.'
In greater San Antonio, Texas, with no action by local elected leaders to slow them down, we now have about 56 data centers either in operation or nearing operation, according to a database created by the Texas Tribune. Discussions to date have been mostly limited to questions of water and power. This newsletter is the first foray in Texas, to our knowledge, on the subject of their impact on urban heat.
Some may recall our June 7 newsletter about a public hearing held over the planned expansion of Vantage Data Centers near Sea World, where the exasperation of residents with TX-2 expansion plans was on full display.
 Greg Harman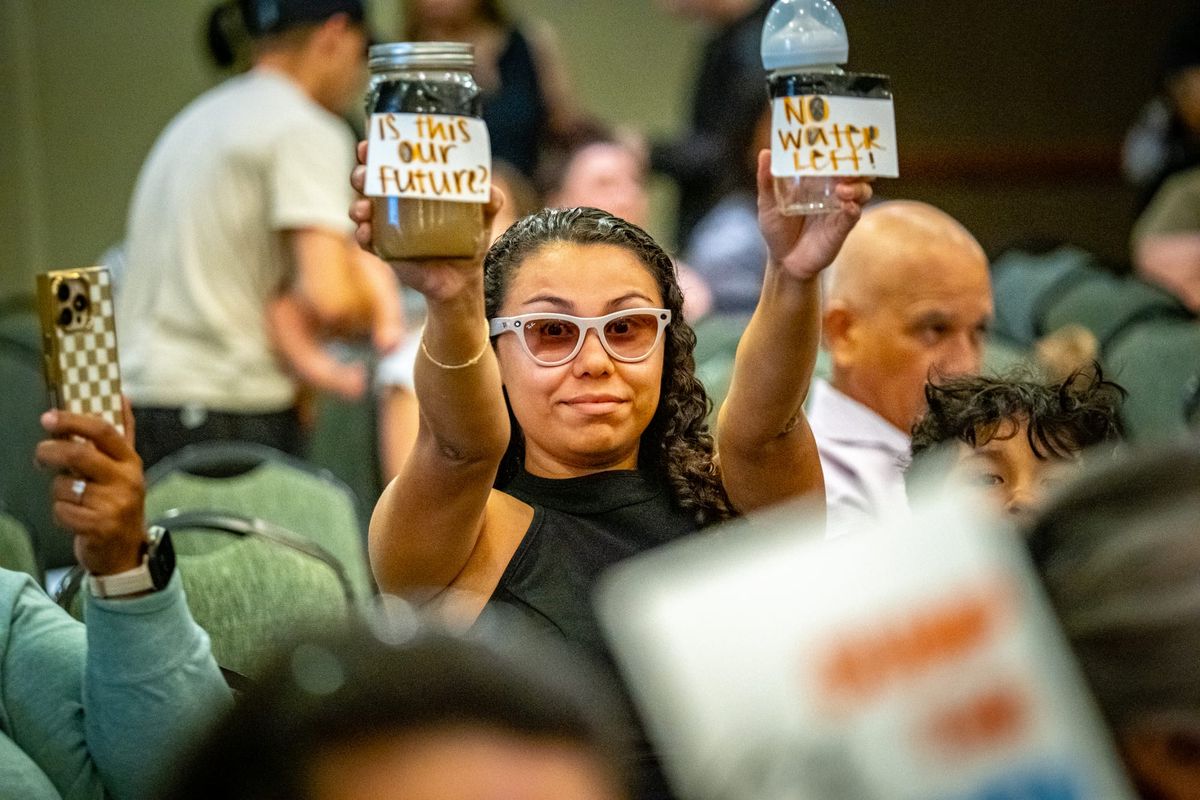
Days later, I popped our drone up to get a birds-eye view of that project, and was struck by the immense size of these facilities—later learning more about the planned power plants here and at the company's Texas Research Park location. This is an expansion now seemingly about to be challenged in court. Recently three environmental organizations filed their 30-day notice of intent to sue.
We next stumbled next into a community forum with far too many open seats in the room considering the tens of thousands of interested views some of our social media clips garnered.
Here we encountered a goodly amount of talk about “doing data centers right,” but no promises to pause them until the City or County can work out adequate safeguards. In the meantime, City-owned CPS Energy reps described being overwhelmed by the volume of power requests: 27GW of inquires and requests in a city that today runs on about 3GW of power. After a year spent winnowing the wheat from the data center chaff, the utility has only drawn that 27GW figure down to about 17GW while roughly 3GW are actively moving toward contract phase.
 Greg Harman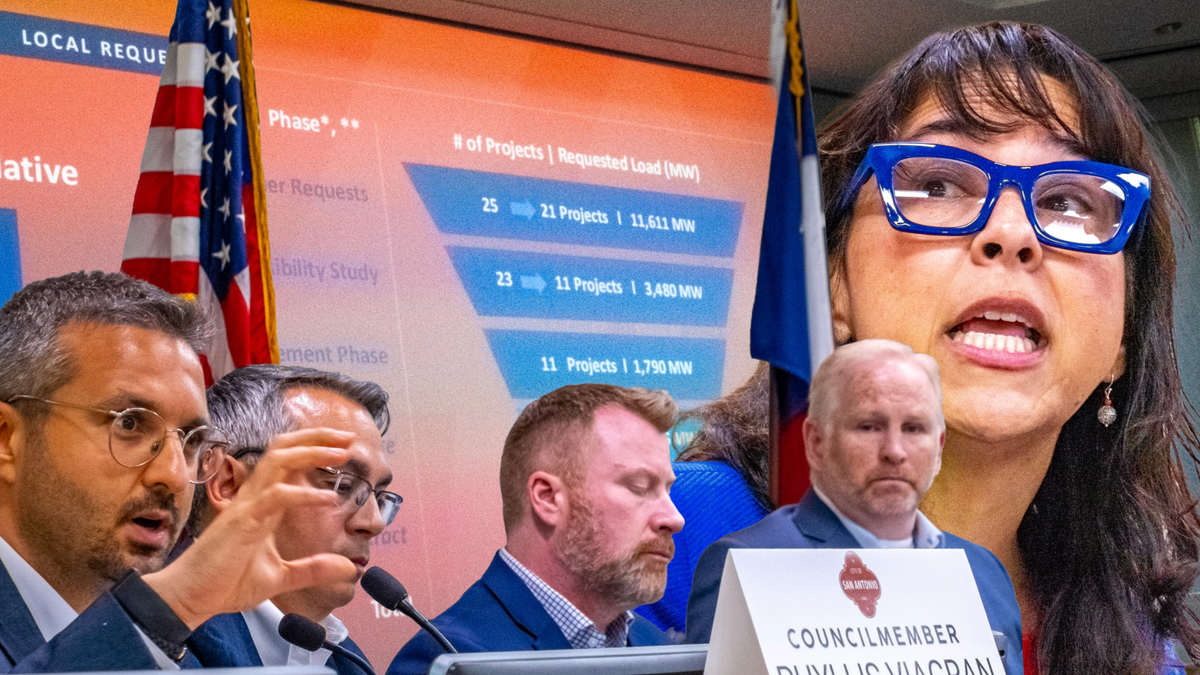
All of this with the utility’s board of directors climbing on board for more gas-fired power in a new generation plan that blows up our climate commitments.
 Greg Harman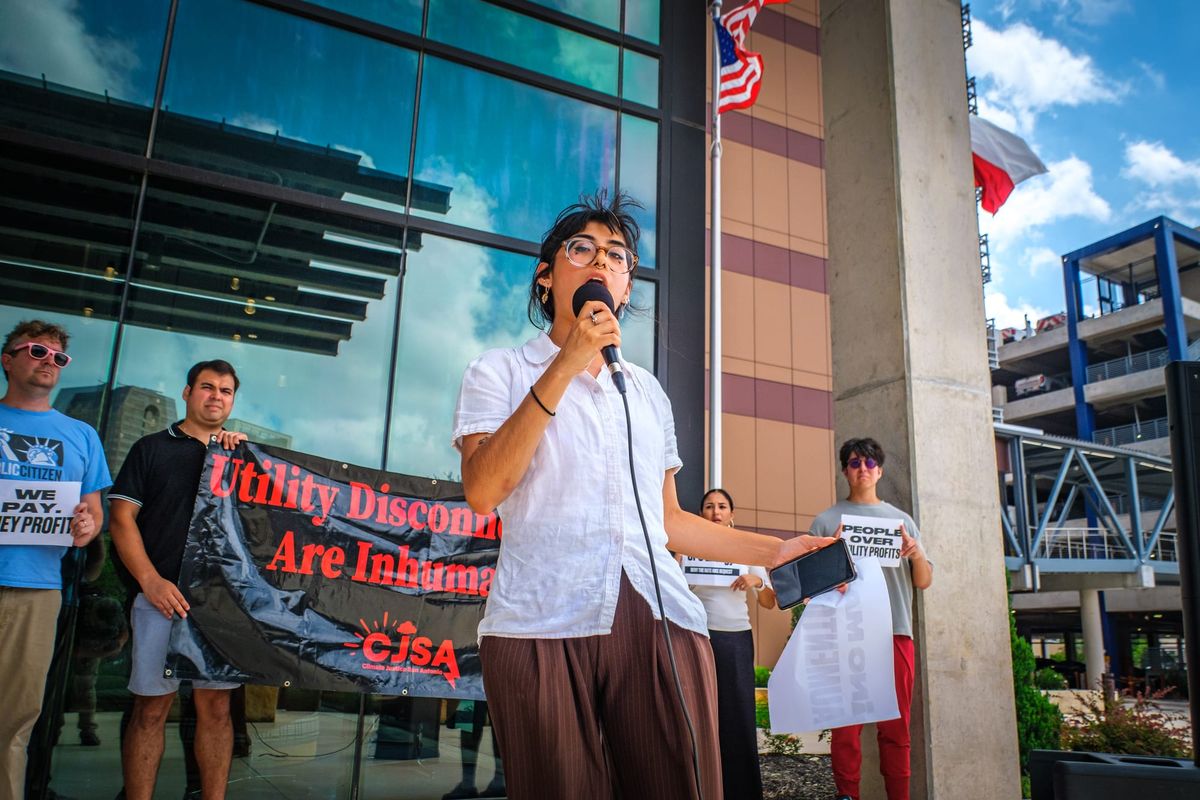
But there has been no public discussion yet about what data centers mean for an increasingly heat-vulnerable city located in a state now 3.5 degrees hotter on average than a few decades ago, where rising nighttime temperatures are making open windows less and less of a protection. No one has asked what happens if these data centers push out what researchers are finding to be an “average” amount of heat for this industry.
That figure is 4 degrees Fahrenheit according to the survey of hyperscale data centers we found posted to ArXiv (pronounced "archive"), an open-source, pre-print archive where STEM researchers upload papers they've submitted for publication, seeking additional feedback beyond the peer review process.
Meanwhile, a peer-reviewed study of Phoenix, Arizona published in the Journal of Engineering for Sustainable Buildings and Cities places that average heat impact at 1.5F. This is heat that doesn’t stop at the fence line, but radiates out for miles.
"Data centers generate heat fluxes of thousands of W/m2, far exceeding any previously studied urban source," the authors of that paper write.
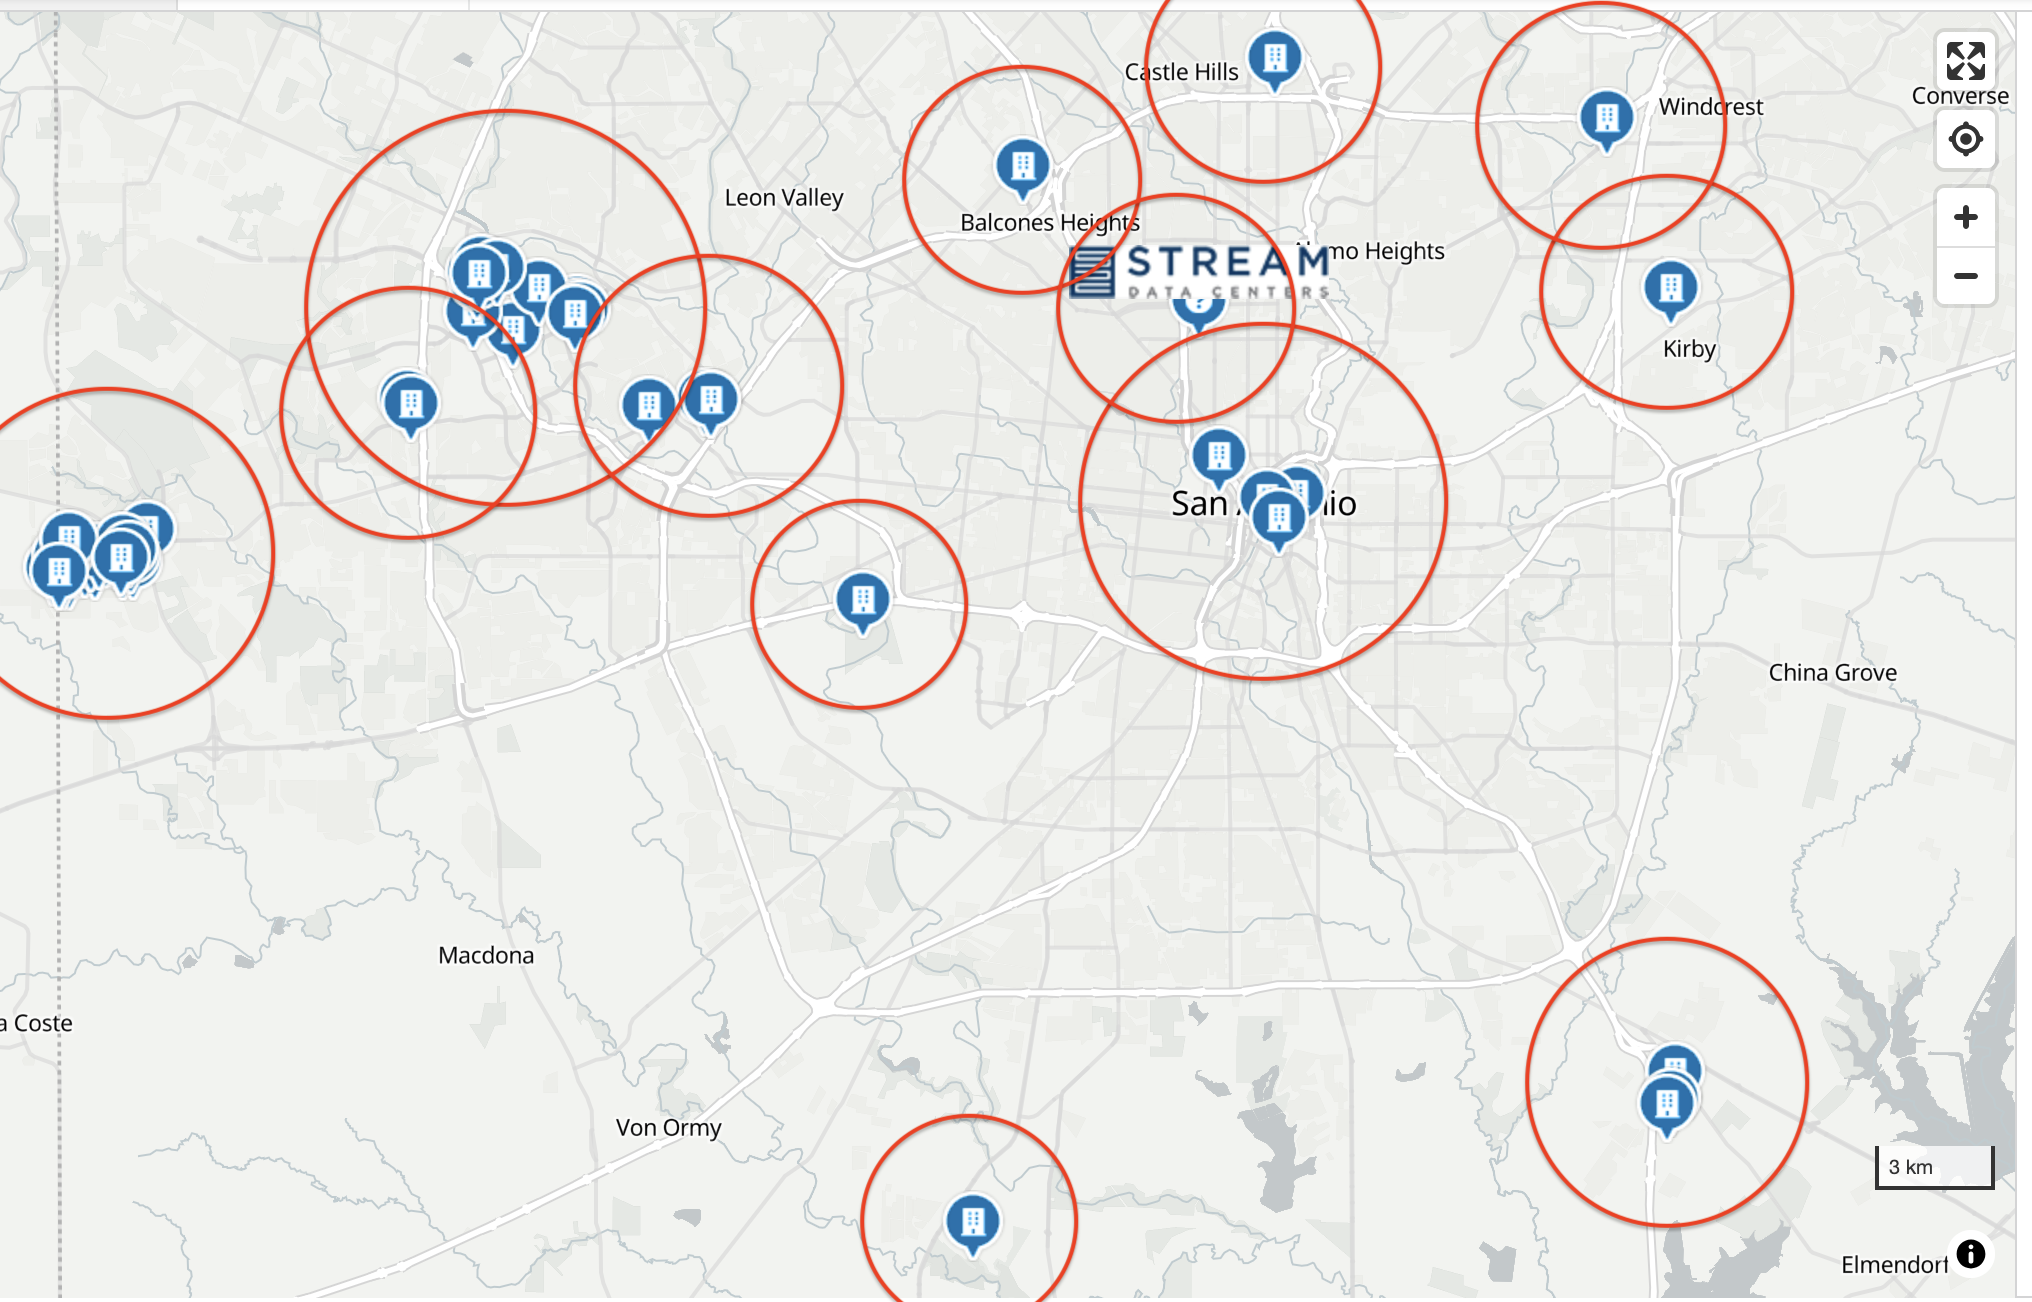
Here’s a crude attempt to illustrate that potential heat influence using an industry-run online data center map—which suggests it's not a trivial question.
Our own exploration, as you'll see in the video above, suggests a definite influence.
Before we started, we checked the wind direction and packed our water bottle. We were headed back to that Sea World Vantage location, where there are also several Microsoft data centers across the street. Quite a cluster. But we stopped to check the heat at a few sites upwind first.
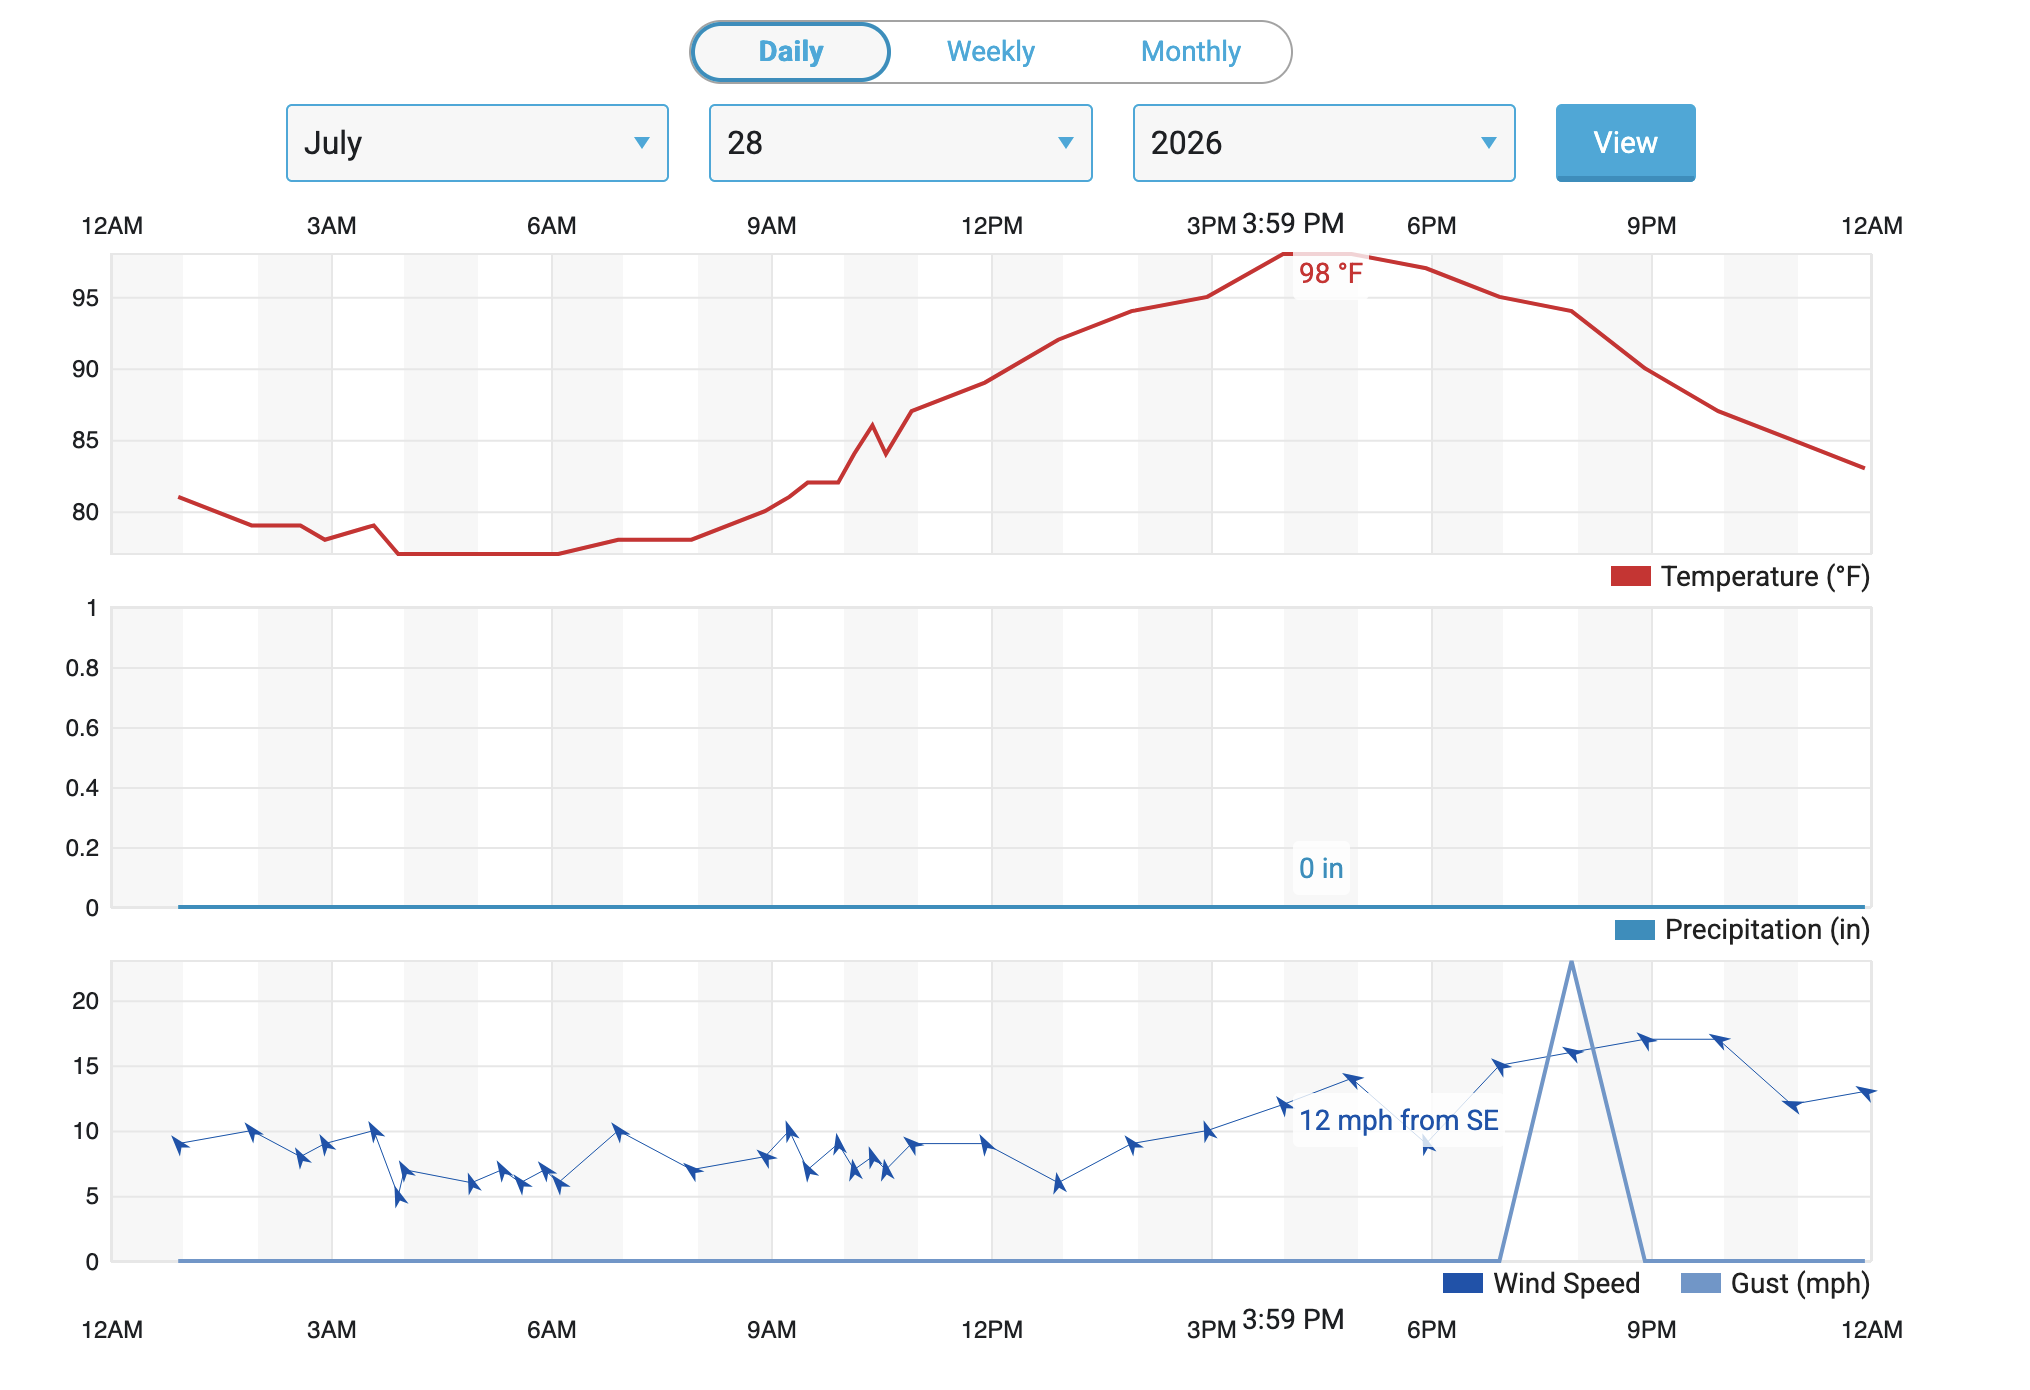
At 4pm, the official temp in San Antonio was 98. But outside our house on the near Westside we recorded temps of 106 and 107.
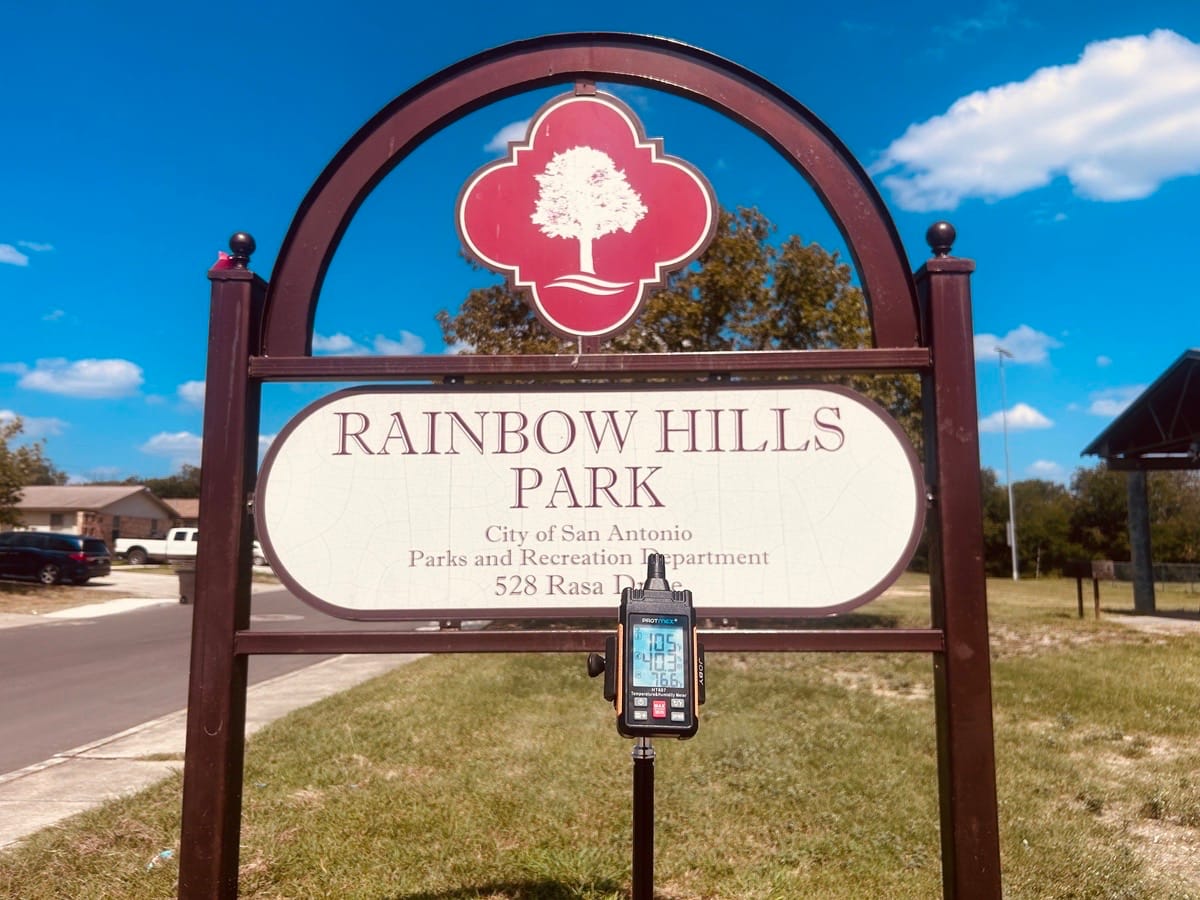
Further from the inner city, we stopped at Rainbow Hills Park, located at 528 Rasa Drive in the 78227 Zip Code, about six or seven miles upwind from the Rogers Road cluster. We waited around for about 20 minutes. The highest temp we captured? 105.
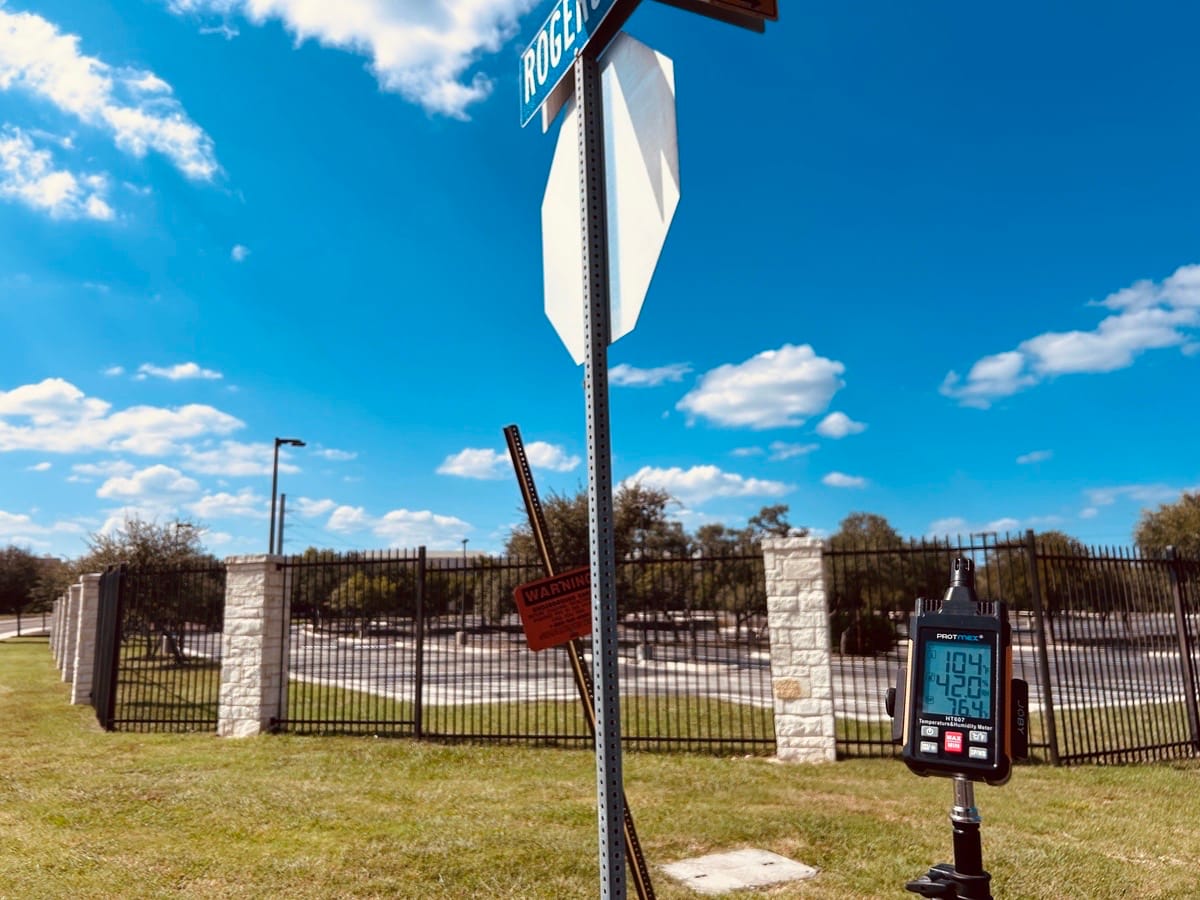
Next we stopped near the One Frost Building (3838 Rogers Rd, San Antonio, TX 78251) about a mile upwind from the data centers. We gave this location about 15 minutes. High temp was 105 (which occurred after we switched from stills, below, to video documentation.)
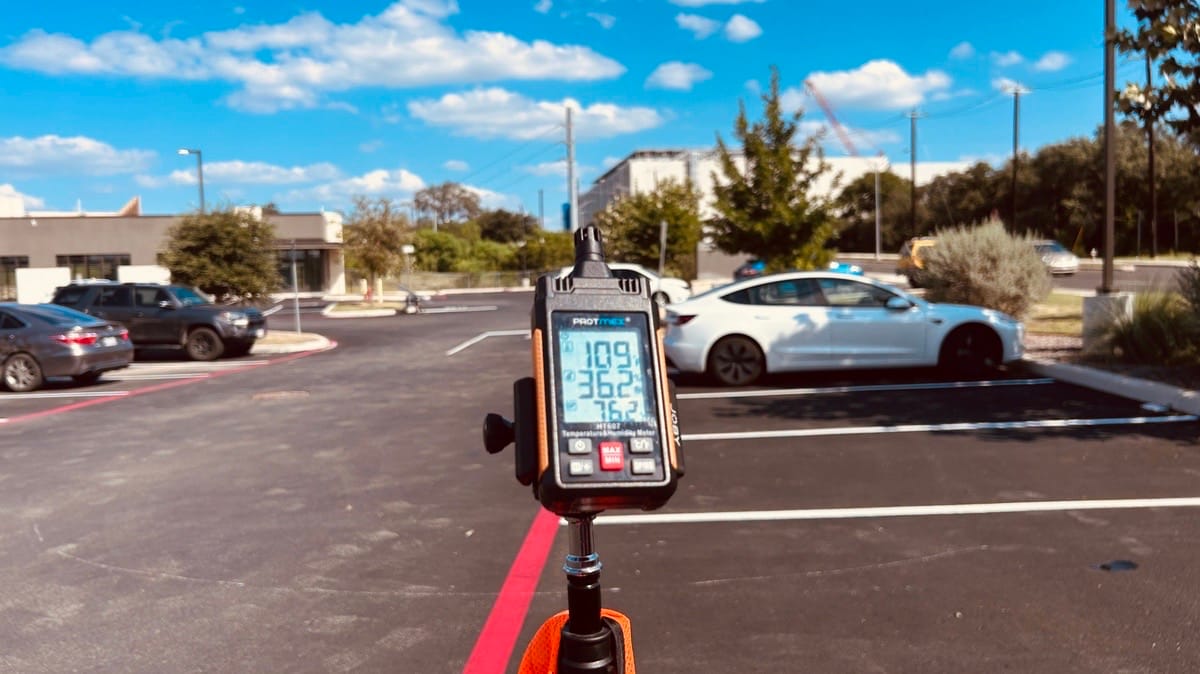
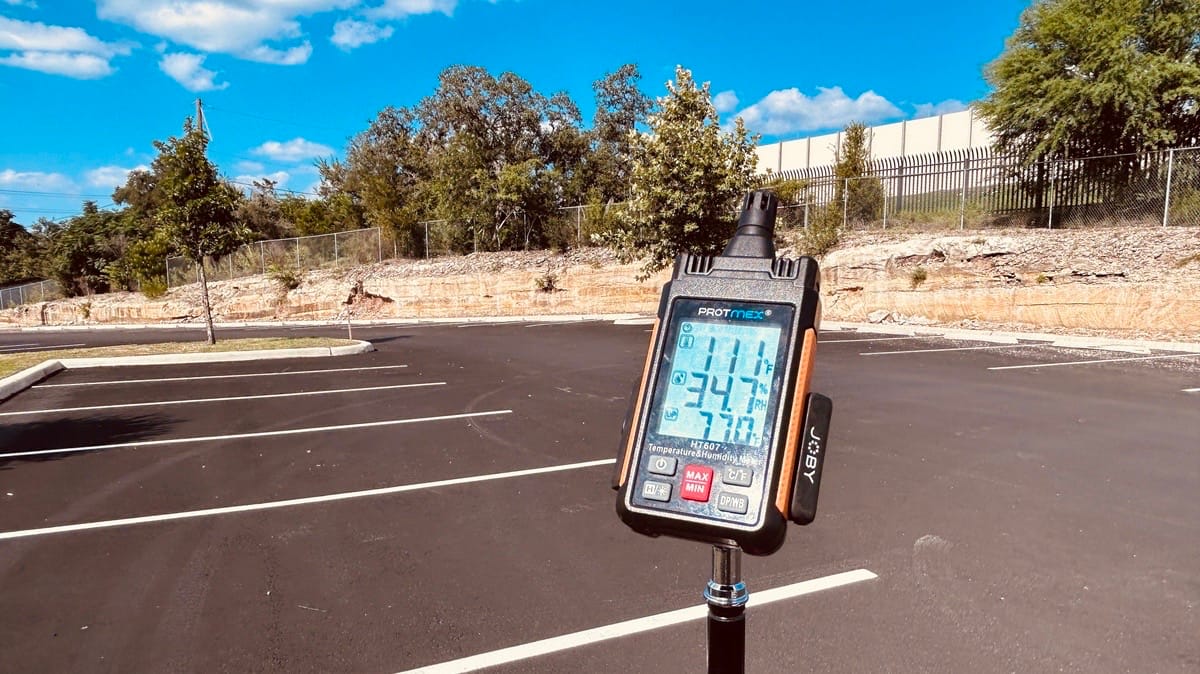
Then we drove a mile further to a parking lot just downwind of the data center cluster (5250 Rogers Rd Bldg 2, San Antonio, TX 78251). Here I started getting a range of higher temps, from 107 to 109.
As the parking lot was virtually empty, I decided to creep a bit closer to Microsoft's fenceline. I put up the drone and turned on the camera. While I was recording my report back about the project, the Protmex HT607 Temperature and Humidity Meter displayed 110 while I was filming. Then 111. Then 112.
Another key finding this week is about how little this topic of data center heat has penetrated the research and policy communities—even as data center development surges forward.
That Arizona study I mentioned was published online on May 18, 2026, and claims to be the first ever to directly study the heat impacts of data centers. (The other, a pre-publication global survey covered by CNN relies on a review of satellite imagery.)
The lead author of the Arizona study, David Sailor, is the director of Arizona State University's School of Geographical Sciences and Urban Planning.
"They're such a concentrated load of electricity consumption, and hence heat emissions, that we became concerned about the impact that they could have locally, and also in the downwind neighborhoods,” Sailor is quoted in an ASU report highlighting the research.
"Even if these data centers only contribute to an additional heat island magnitude of 1 degree or 2 degrees, that can still have a very significant impact on our lives," Sailor said.
My crude investigation found a significantly higher difference between the upwind and downwind temps, ranging between 2 and 7 degrees (the lowest reading I got downwind of the cluster was 107).
But the cumulative impact of all these already-existing data centers—even if the contribution is at the lower end—feels like a game changer for cities like San Antonio. Especially when coupled with the collapse of CPS Energy's commitments to its climate goals and the dramatic expansion of power demands in service of data centers.
I asked Laura Patiño, director of San Antonio's Office of Resilience and Sustainability, about the heat being emitted by these facilities in light of her office's commitment to reducing heat island impacts.
"We must properly understand the impacts these new developments are having in our city and put measures in place to mitigate those," Patiño told Deceleration.
"We have to evaluate what we’re seeing on the ground ... to make sure that San Antonio continues to grow, advancing economic opportunity, but also mitigating negative impacts that urban developments can have."
Clearly it's not just cities being impacted. Many data centers are moving into rural areas to secure the land, water, and power they require.
"How does it impact the plants and animals and crops that are getting 10 to 15 degrees more heat coming at them constantly?" asks Brady, Climate Central's data analyst. "Basically, these data centers are up and running constantly.
"There are a lot of different things that need to be looked at," Brady said. "Ask any farmer if climate change has impacted them and they will say yes."
So wouldn't Patiño prefer having good policies and regulations in place before these things get constructed? To prevent heat spinning off in the first place?
Yes, she said.
"Integrating sustainable design from the beginning allows us to be more cost effective with capital investments but also have more impactful projects that ...maximize the benefits we get from the projects in the long term," Patiño said, "rather than [having to] backtrack and trying to fit them once something is already built."
Of course it's not City staff that lead these conversations. They serve at the pleasure of the city council and mayor and a city manager who guides the implementation of the policies they adopt.
"We will follow the direction of our mayor and council and be ready to provide any data, information, and support," Patiño said.
While other communities have banned data centers or put laundry lists of requirements in place to try to keep out the worst actors, San Antonio continues to study the issue.

Buy Greg a Coffee
Already a subscriber? Show your appreciation for Water & Power's investigations and analysis by leaving a tip here.


